Using EMHealth
Dashboards
Once you login into Grafana at http://localhost:3000, you may want to adjust the default preferences. Navigate to Administration > General > Default preferences where you can set the interface theme, week start etc. We recommend to set Home Dashboard to TEM/Fleet overview.
At the moment, all dashboards are grouped into TEM, SEM and DB performance folders.
TEM dashboards
Overviews
Fleet overview
This is the main dashboard, which can display multiple instruments simultaneously. Key metrics include:
Beam Time Pie Chart: Shows the daily average vacuum status of an instrument, including time spent with column valves open or closed, or during cryo-cycling.
Utilization Gauge: Indicates the daily average time the instrument spent actively acquiring data on EPU/Tomo.
Last Cryo Cycle: Occurred X days ago.
Specimen Throughput: Tracks the number of cartridges and cassettes loaded over time.
Data Throughput: Displays the number of offloaded movies and total data volume (Falcon cameras only).
Productivity
This view shows per-instrument counters for autoloader cartridges/cassettes, acquired images, and EPU/Tomo sessions. The utilization and beam time bar charts provide alternative representations of running acquisition time from the main dashboard.
For each EPU session, we track:
Session ID
Start and End Time
Actual Acquisition Time
Total Number of Images Acquired
Skipped Images Counter
Acquisition Speed
Error Status (whether the session ended with an error)
For each Tomo session, we track:
Session ID
Start and End Time
Actual Acquisition Time
Total Number of Images, Tilt Series, and Search Maps Acquired
Acquisition Speed
Error Status (whether the session ended with an error)
Alerts
Provides instrument summary and recent alerts for each microscope module
Modules
Autoloader
Pressure, axis movements, temperatures, and LN levels are continuously monitored. This view helps you:
Estimate the baseline pressure of the autoloader
Verify the reproducibility of arm movements
Track LN refilling frequency
Monitor temperature recovery of the CRT and docker after cassette loading
Column
This view displays:
Buffer cycle status
Cryo cycle frequency and duration
Lens temperatures
IGP vacuum levels and lifetime
Optics board errors
Detectors
Projection vacuum, overall status and sensor temperature for detectors and energy filter are provided
Motion
Tracks motion errors for stage axes and all apertures
PC Health
Microscope PC statistics
Source
Various parameters for FEG and HT are being monitored
For developers
Data browser
Mostly used for visualizing raw data from the database
Import Alarms
Note
This functionality is currently under development
Universal Error Codes (UECs) or Alarms from an instrument are stored in a database separate from Health Monitor events and
can be typically displayed with UEC Viewer on the MPC. You could also install FEI UEC Notifications Exporter and save UECs to XML,
but this is not supported by EMHealth. If you have the credentials to access the MSSQL server on MPC,
you can import UECs from MSSQL into EMHealth database. To make it work, MSSQL_USER and MSSQL_PASSWORD (in the docker/.env) have to be defined,
as well as the server field for each instrument in the instruments.json.
emhealth db -d tem import-uec
Alerting
This functionality is currently under development.
Export data and reporting
You have several options available here:
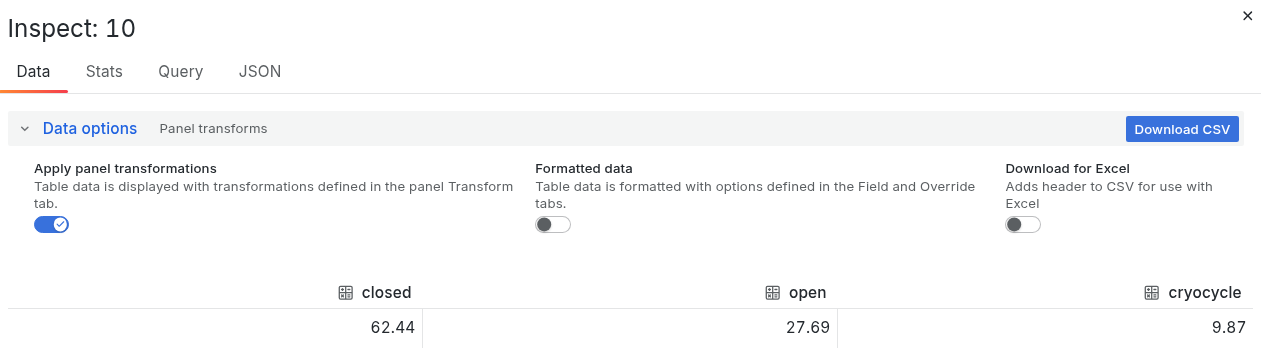
To export raw data from a panel to CSV/Excel format, select Inspect > Data. The new window allows you to configure export options and download CSV
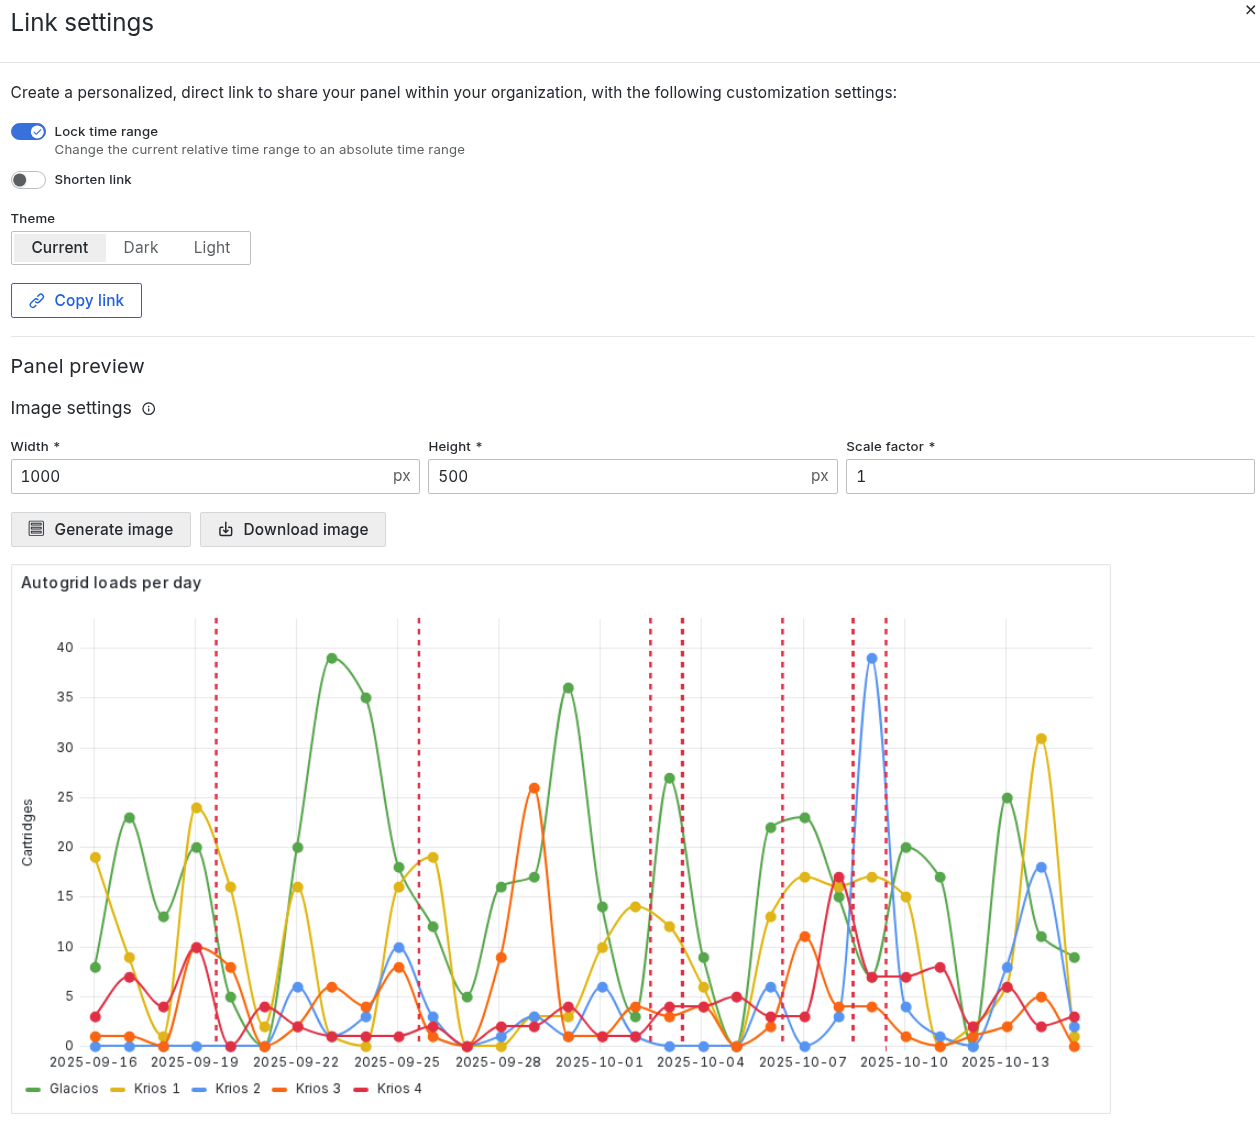
To render PNG image of a panel, select Share > Share link. In the new window you can customize the image size, then Generate and Download image.