SEM dashboards
Overviews
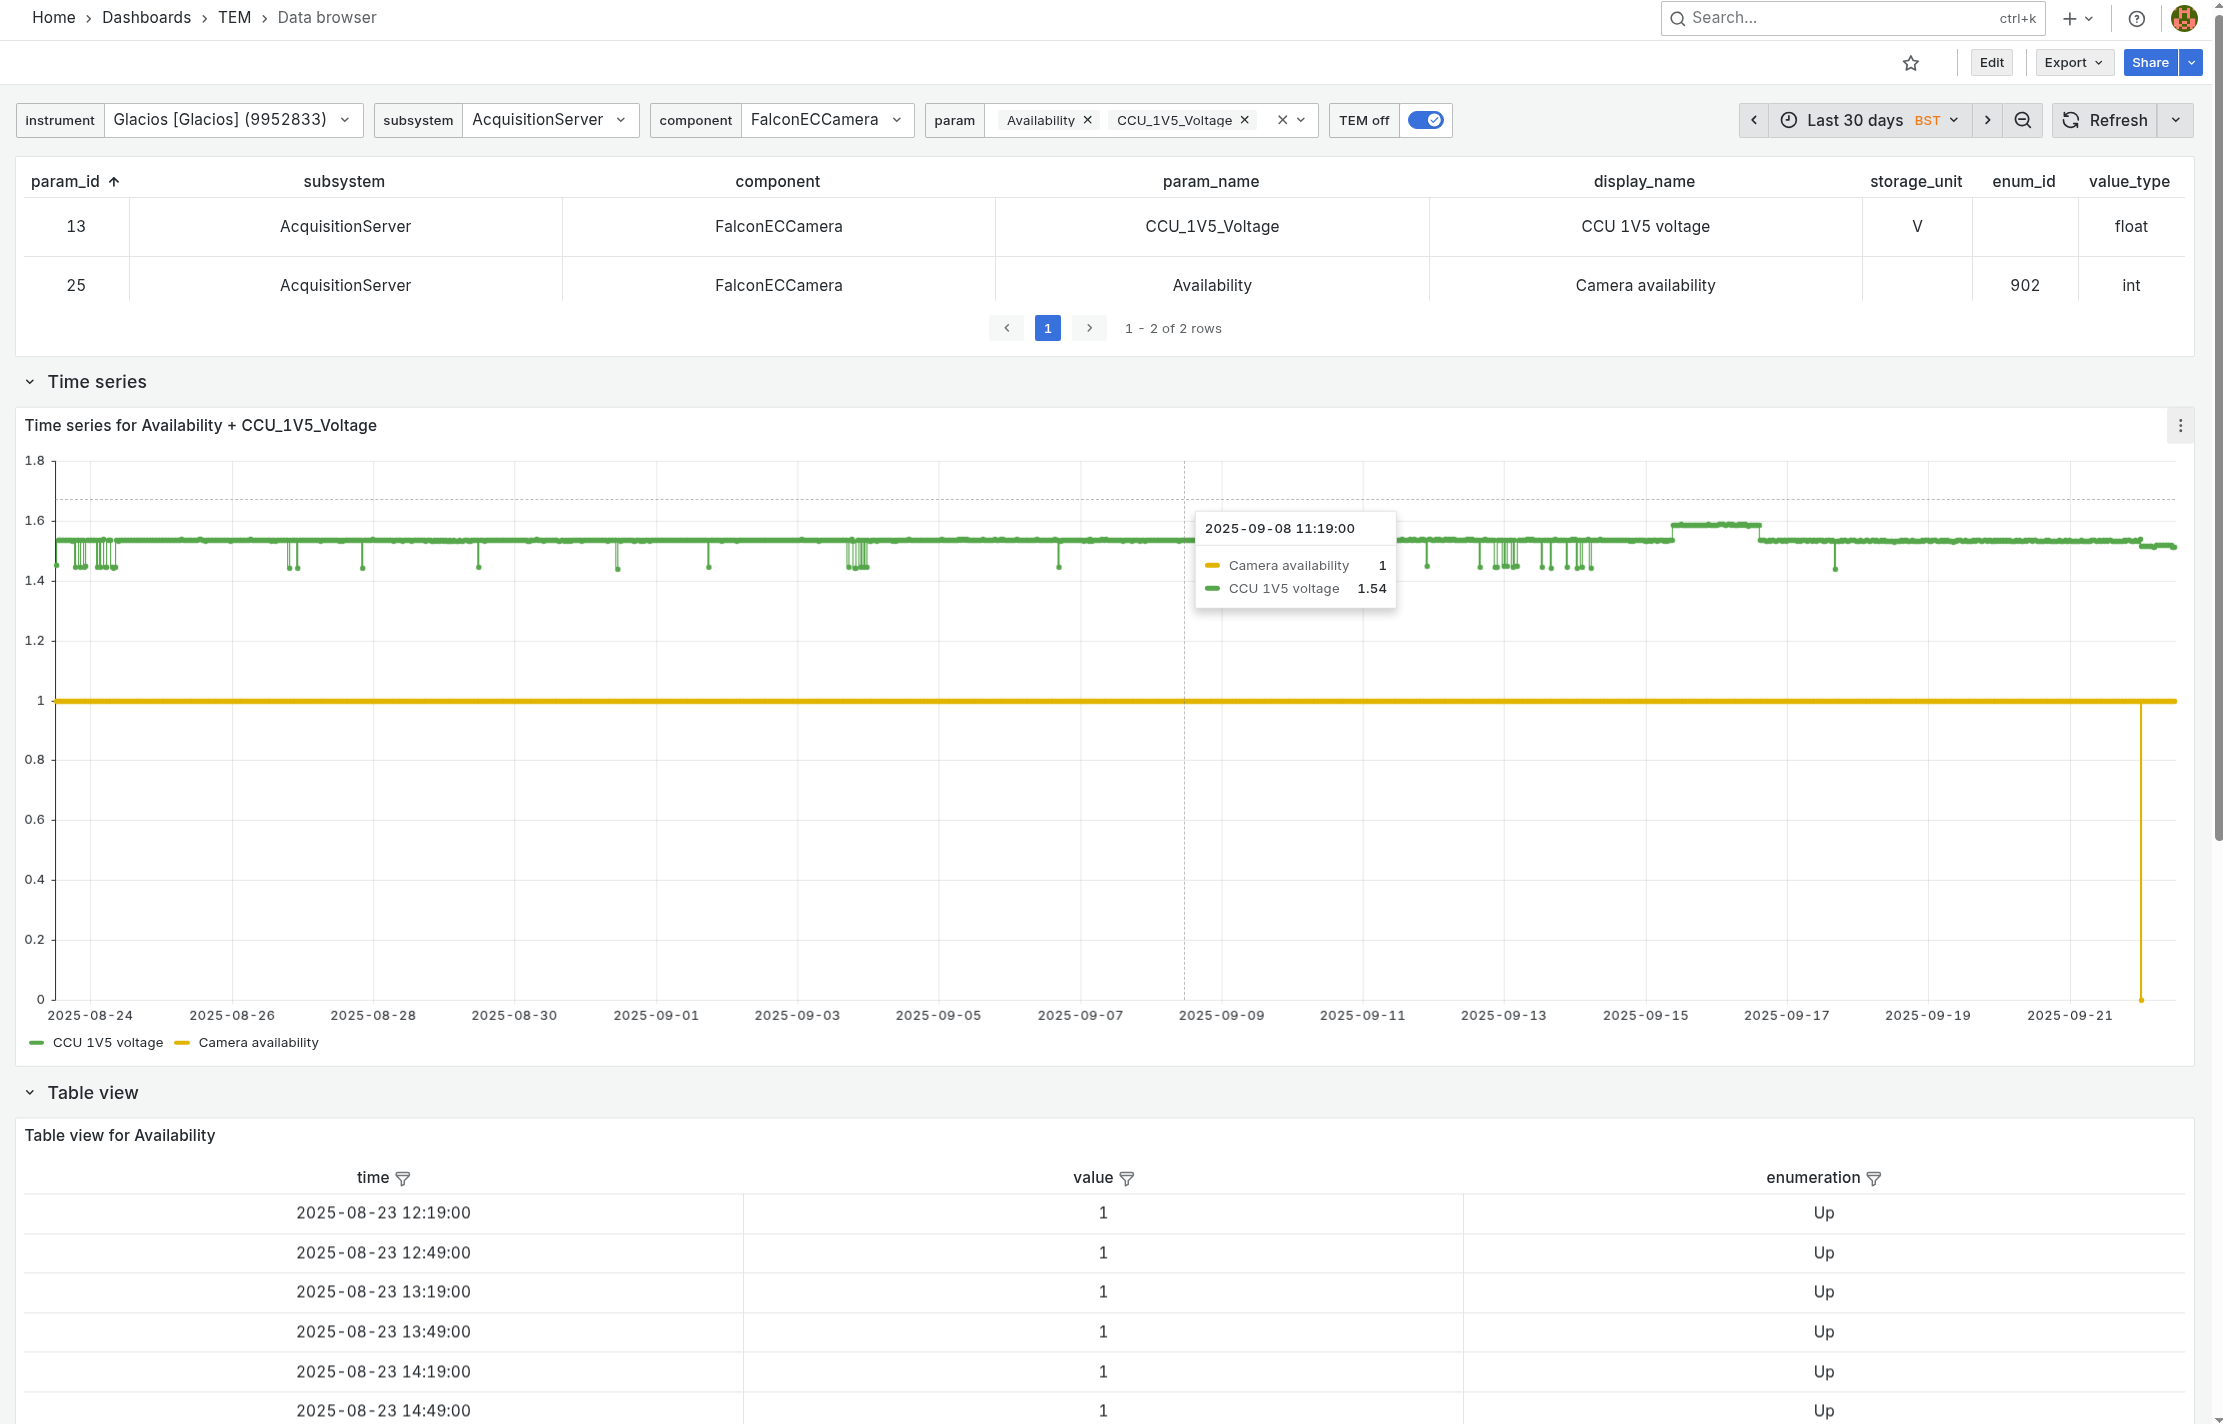
Fleet overview
The main overview which compares several key metrics across all active instruments for the last 30 days
Beam Time: pie chart based on instrument utilization (ion beam, electron beam, iFLM, vacuum actions, cryo cycle or offline)
Ion source lifetime: source age and last replacement date
Last Cryo Cycle for autoloader/quickloader and column
Total GIS usage since counter start, in hours
Specimen Throughput: the number of cartridges and cassettes loaded daily (Arctis only)
Productivity
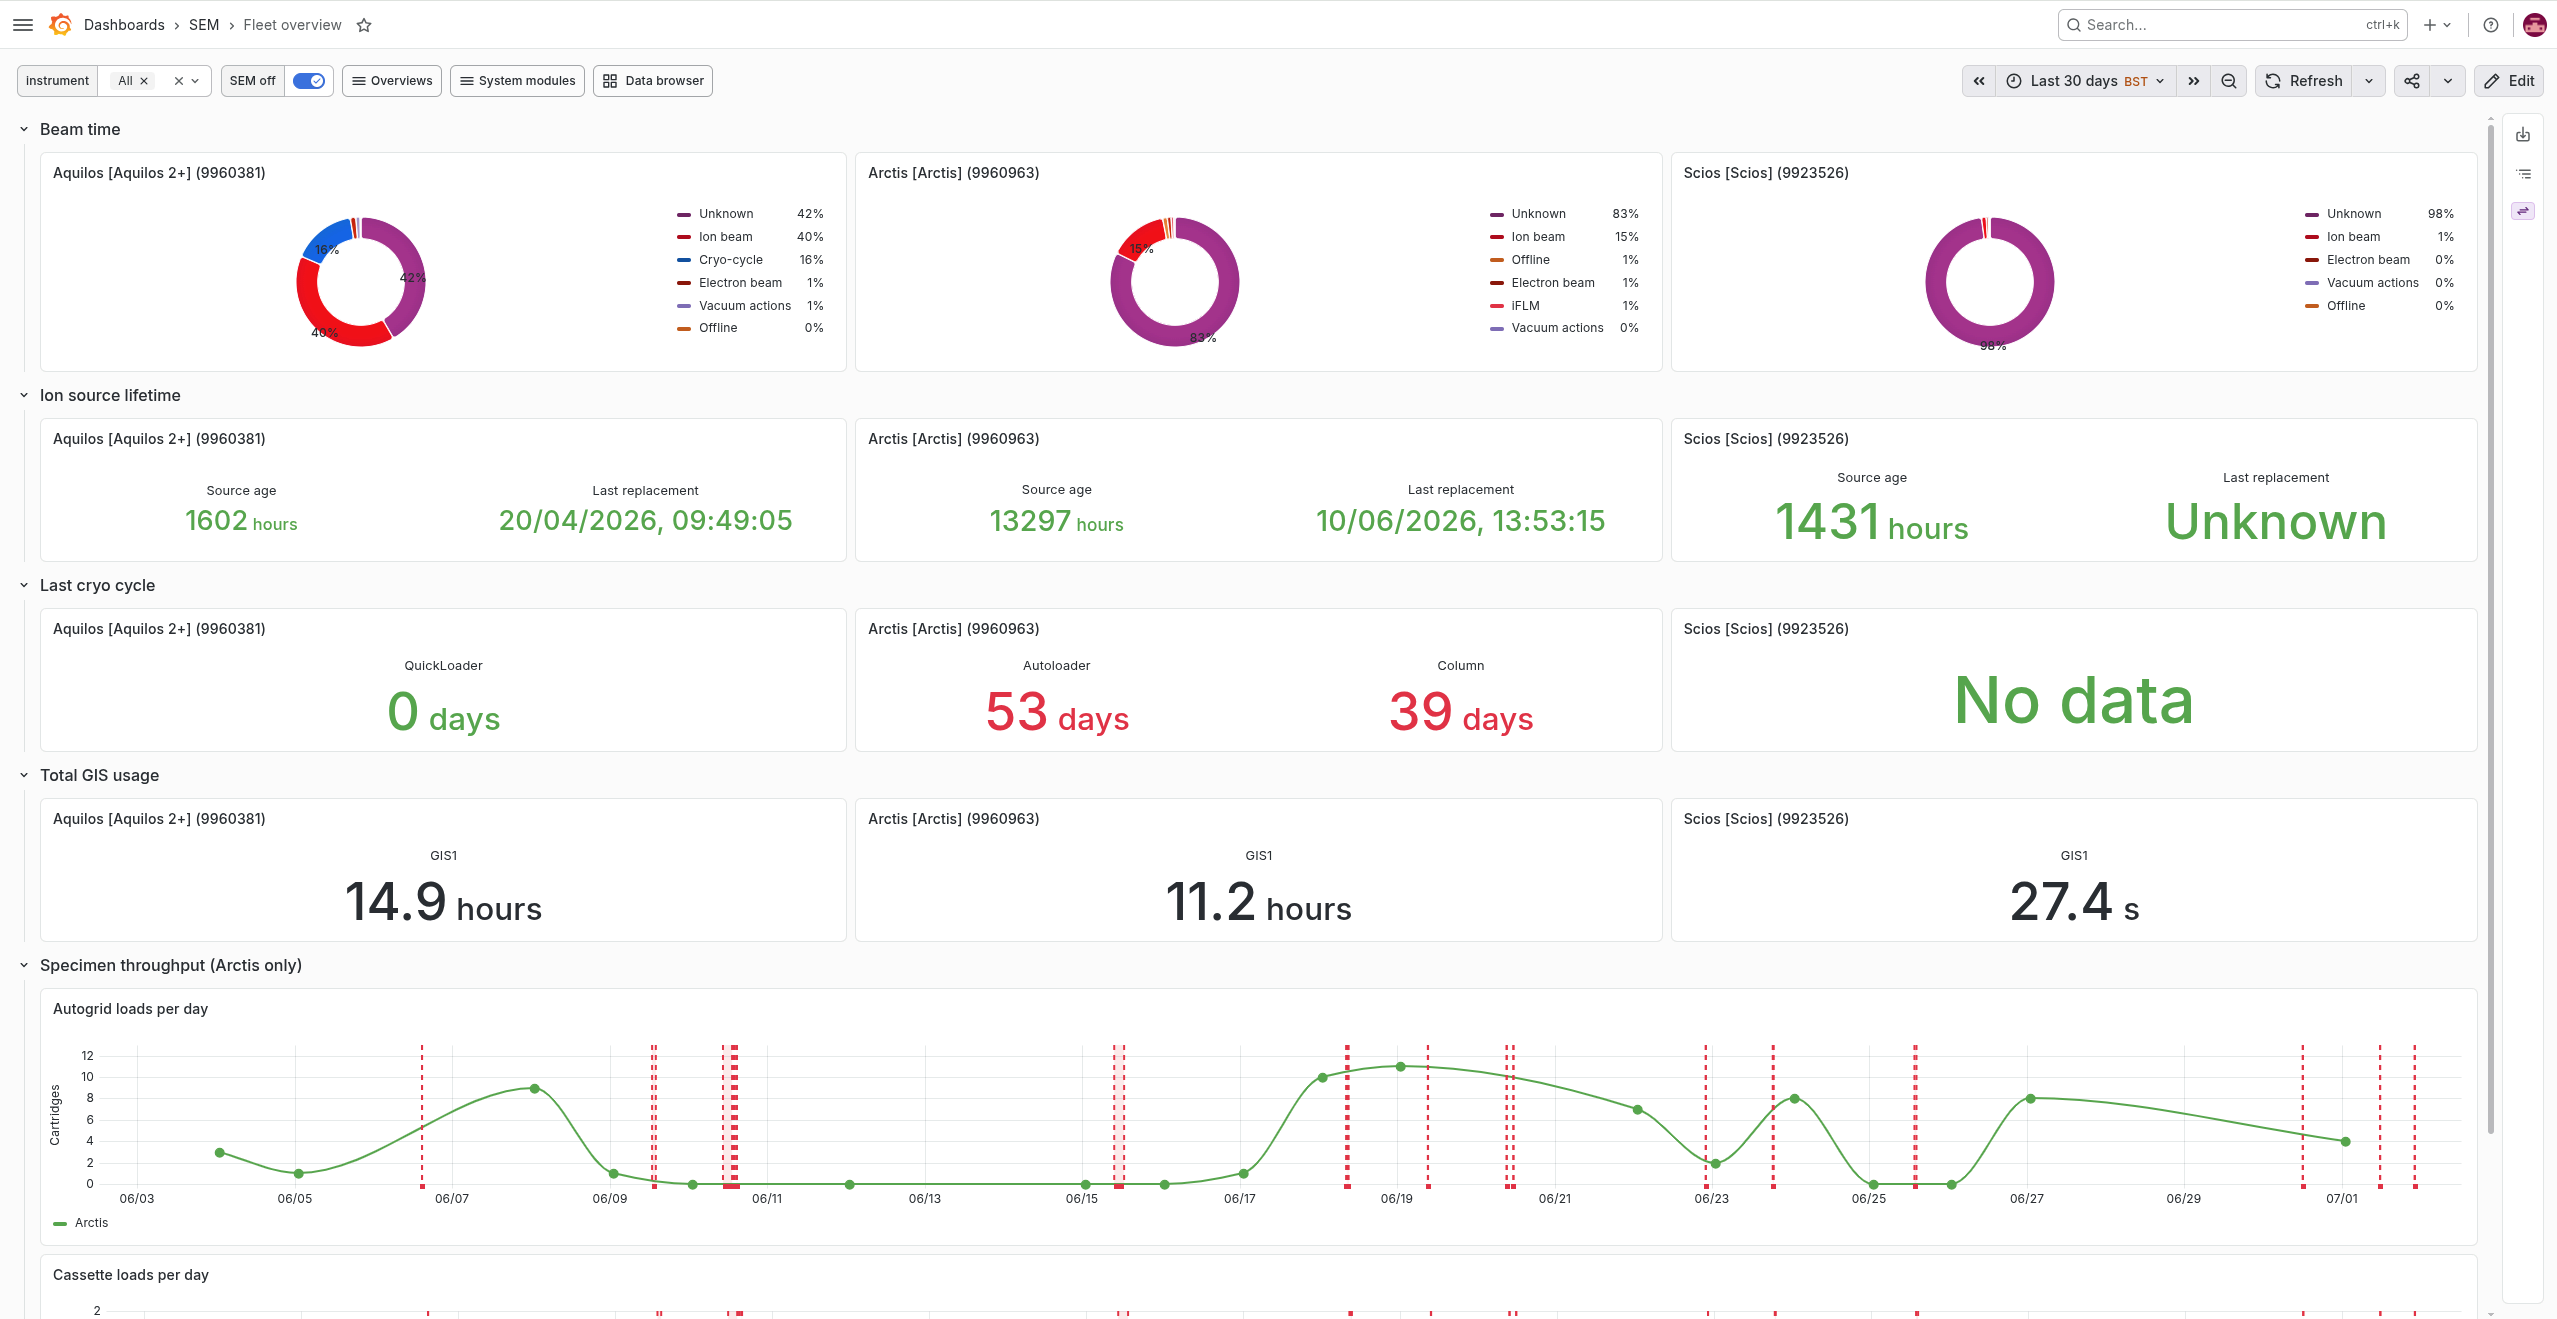
This view shows per-instrument counters and time series:
autoloader cartridges/cassettes (Arctis only)
beam time over time
PFIB gas type usage (Arctis only) over time
GIS usage over time
Alerts
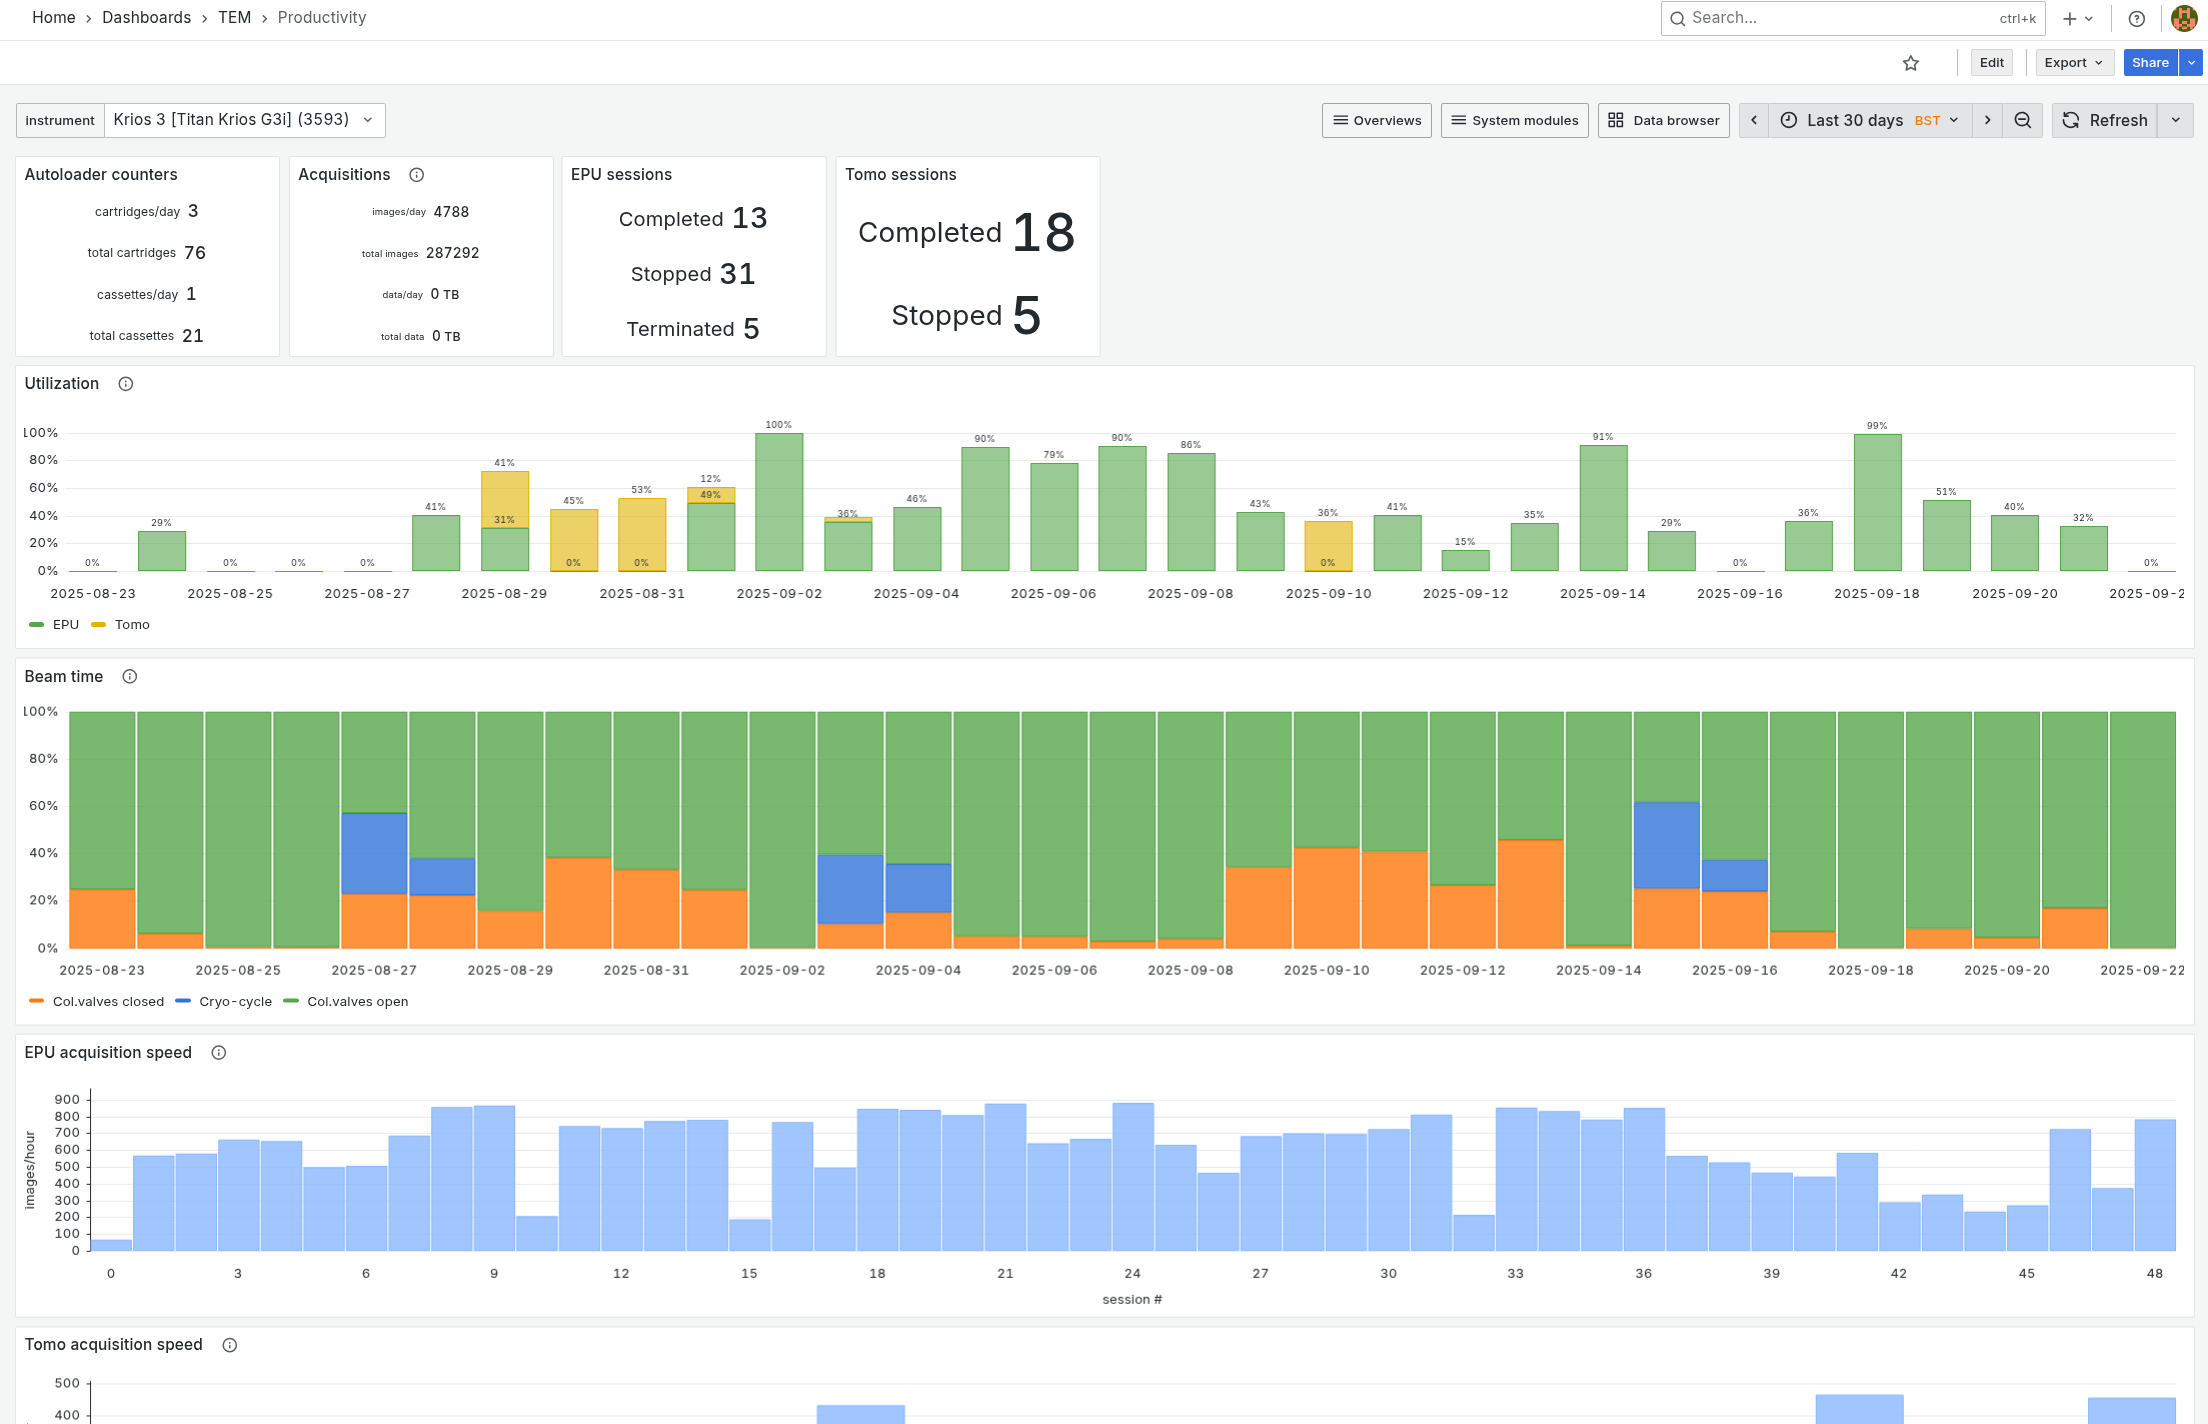
This dashboard provides instrument summary and recent alerts for each microscope module
Modules
Apertures
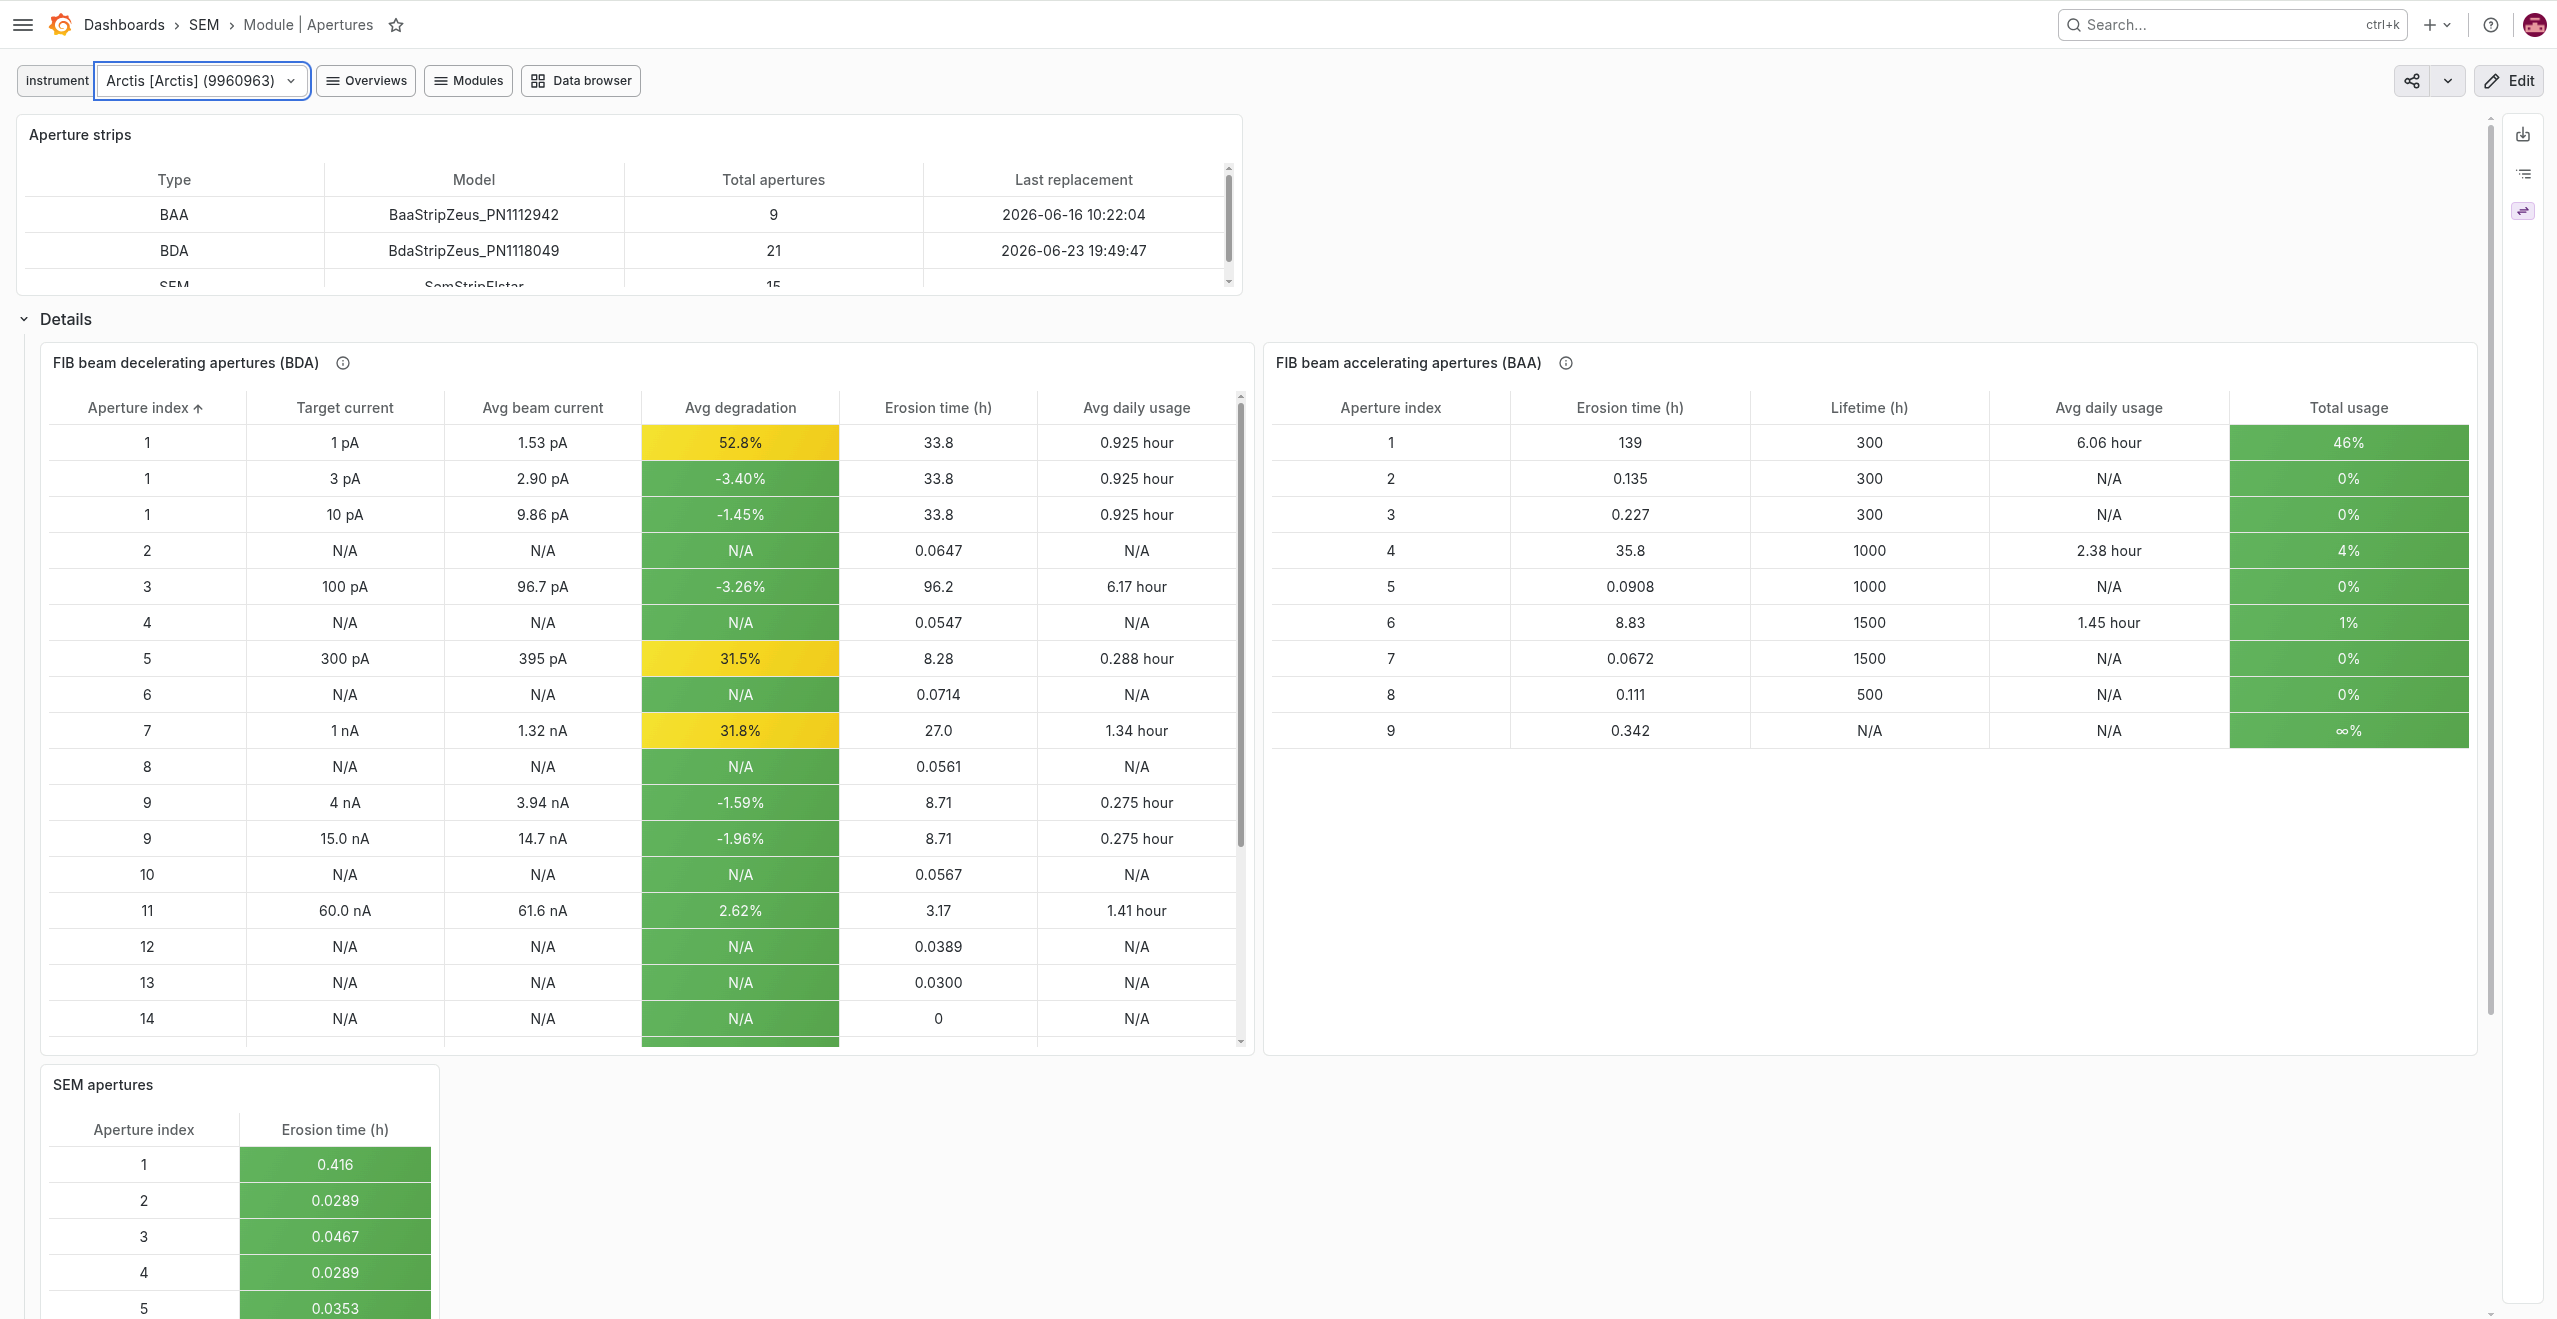
This view display overall summary of FIB/SEM aperture strips and detailed utilization for each aperture index
Autoloader
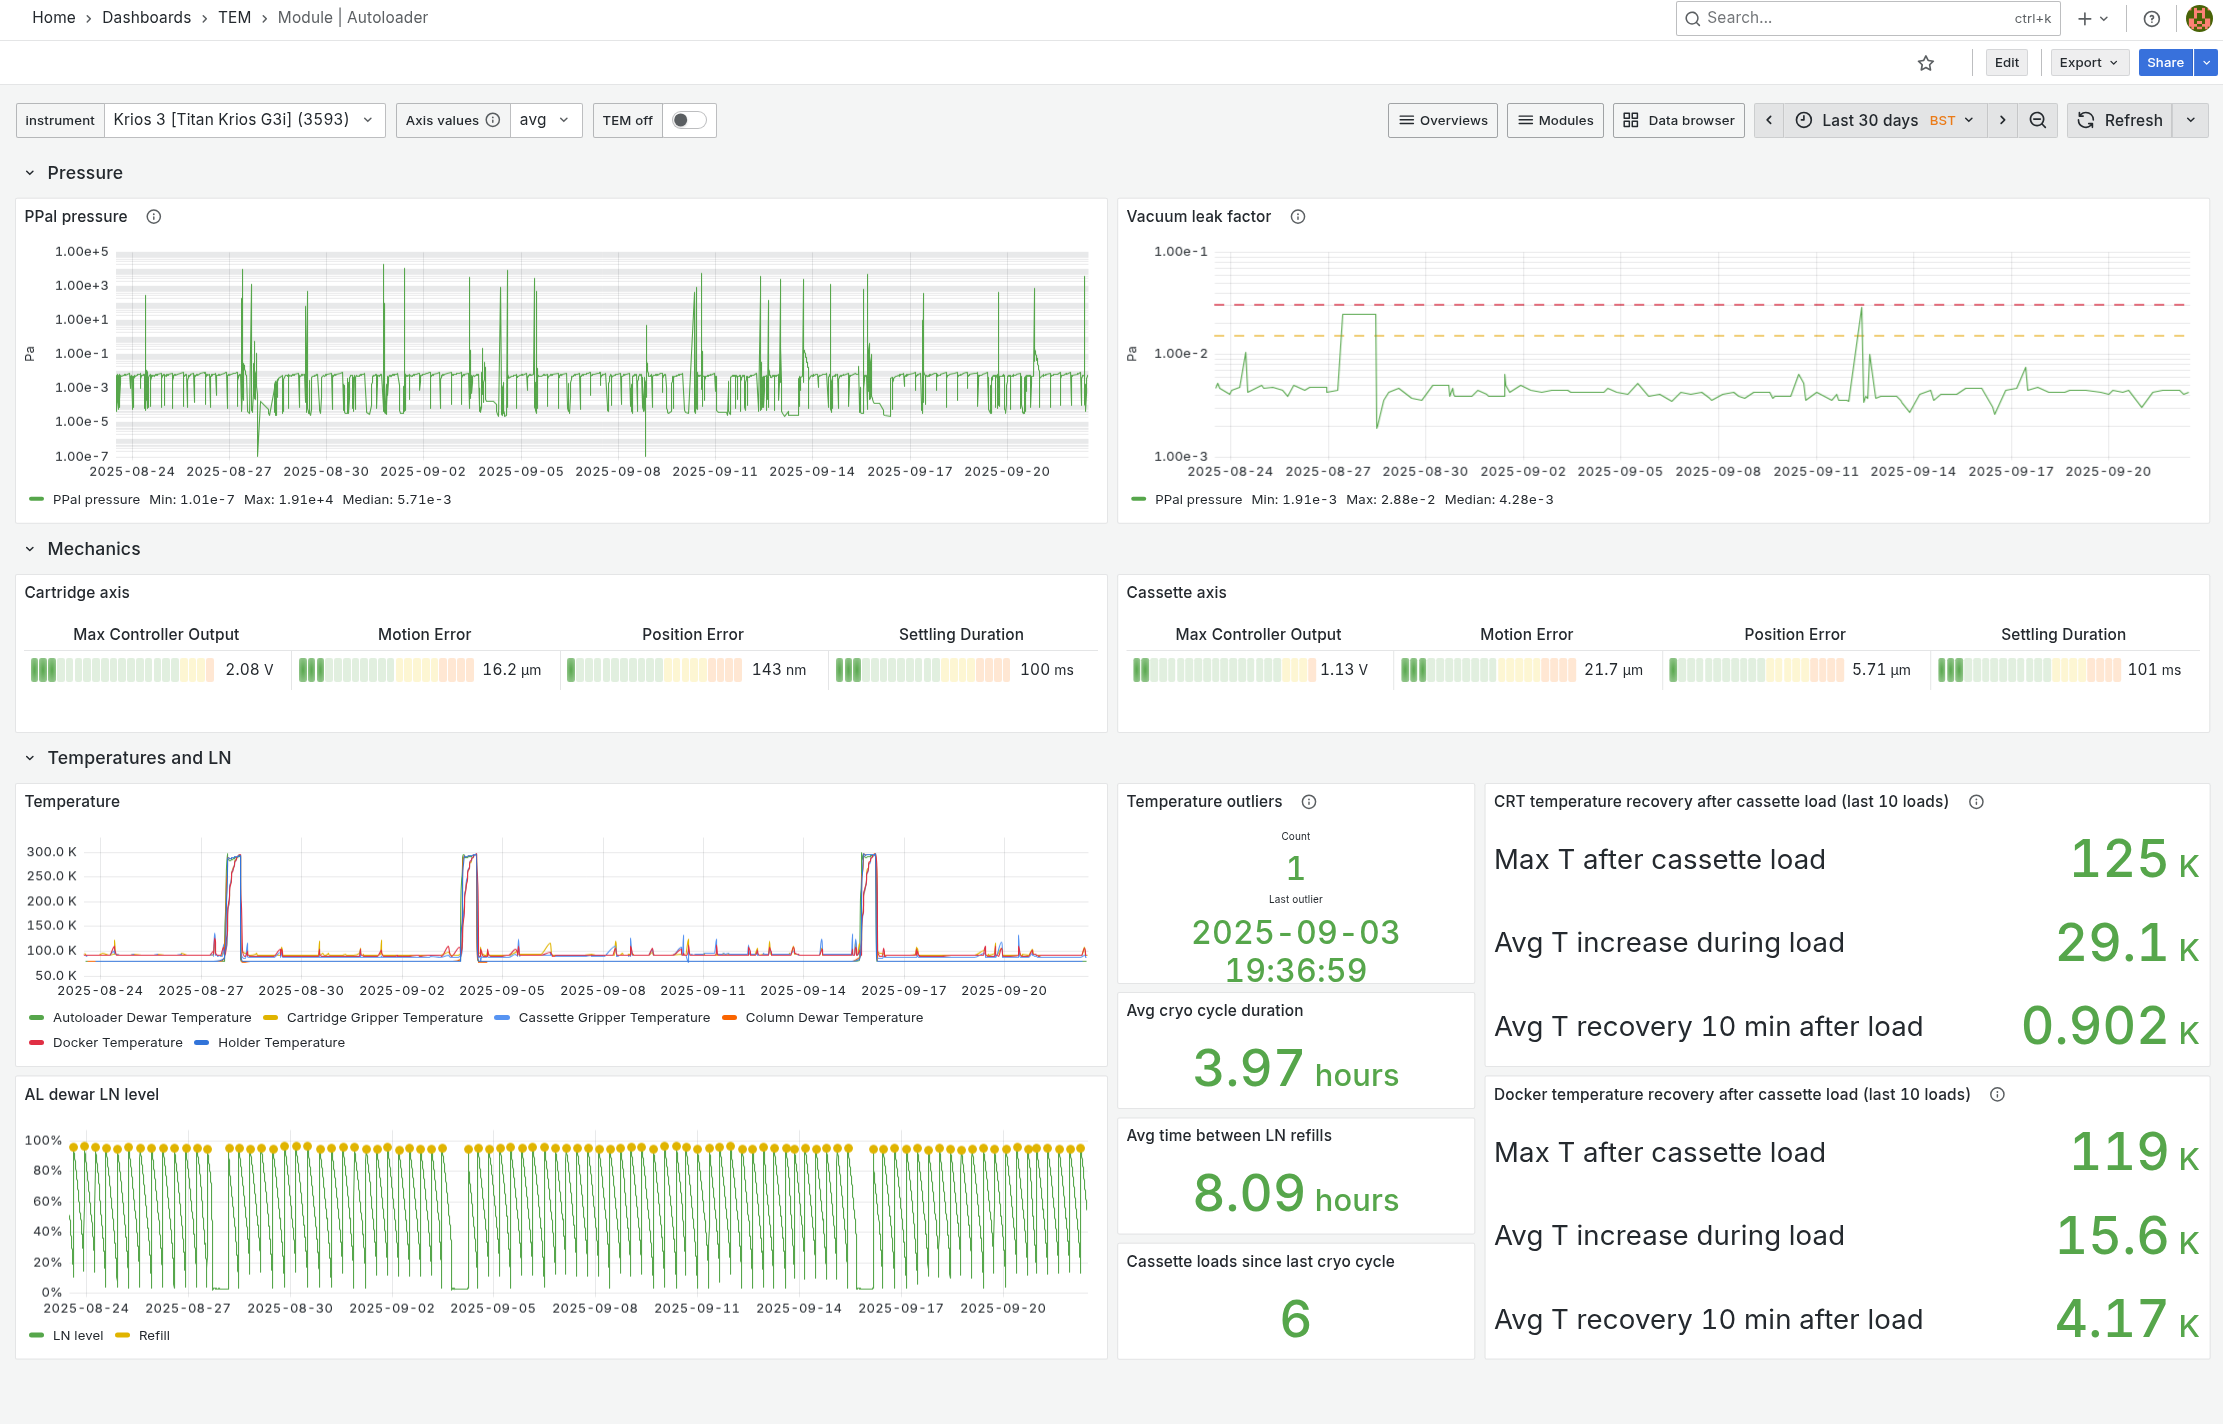
Pressure, axes movements, temperatures, and LN levels are continuously monitored. This view helps you:
Estimate the baseline pressure of the autoloader
Verify the reproducibility of axes movements
Track autoloader components temperatures
Track LN dewar refilling frequency
Display average autoloader cryo cycle duration and number of cassette loads since
Monitor temperature recovery of the CRT and docker after cassette loading
Column
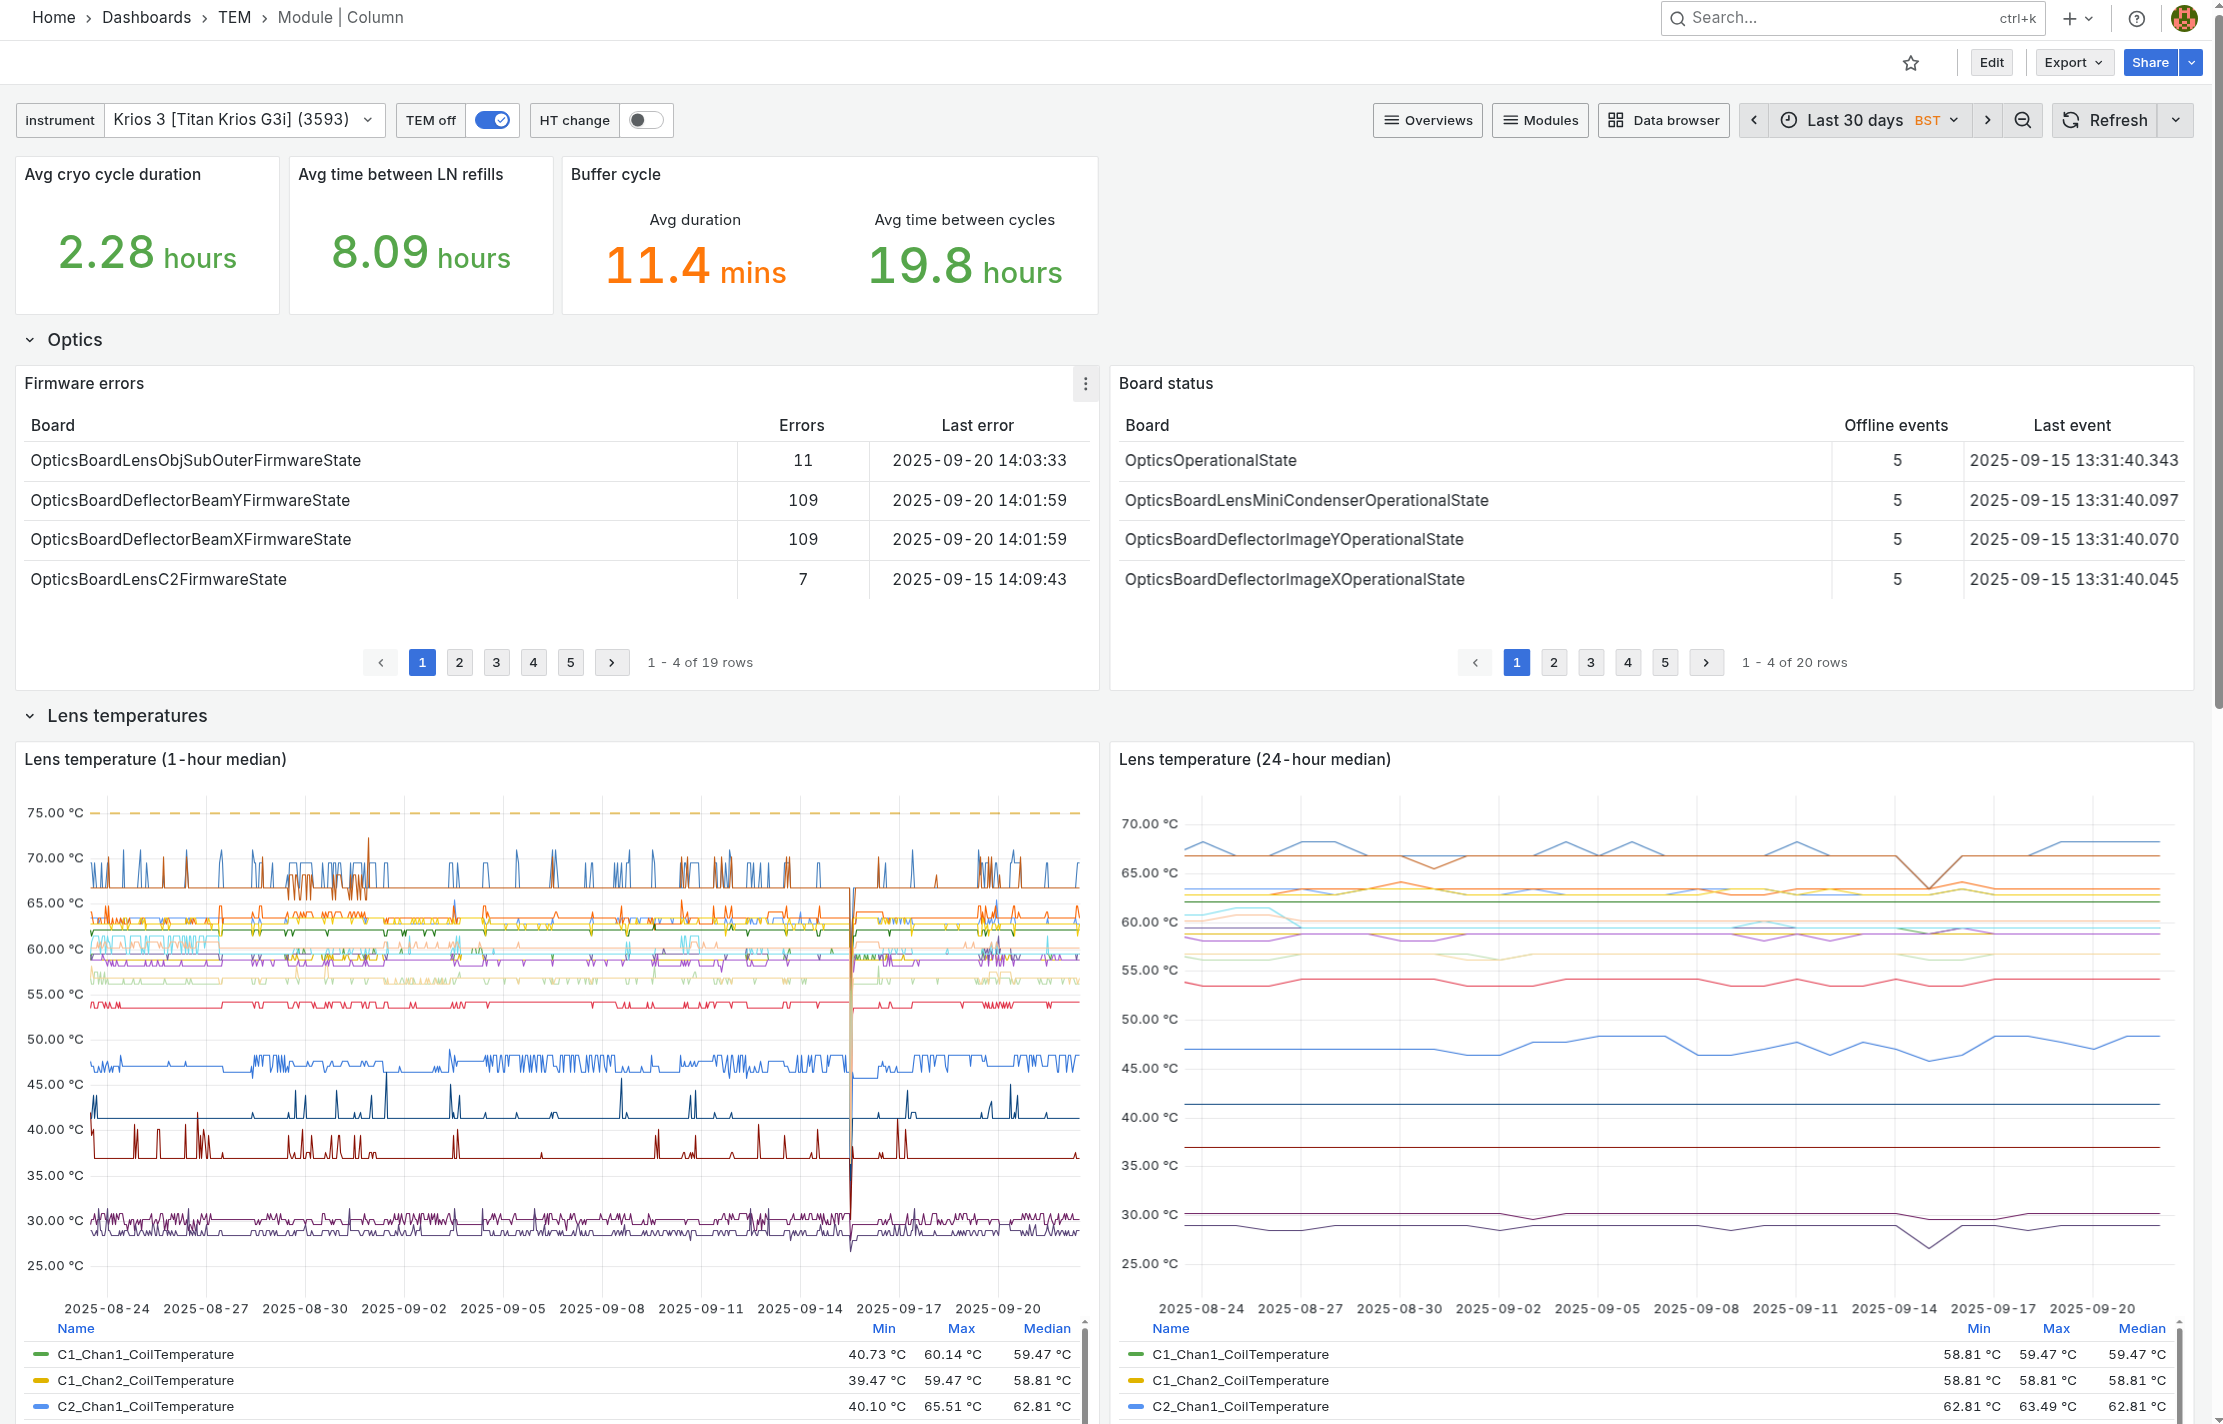
This view displays:
HVG pressure for chamber vacuum
Column cryo cycle frequency and duration
GIS usage summary
PVP lifetime and states
Chamber interlocks
Buffer cycle statistics
For Aquilos systems, we track extra parameters:
Quickloader pressure
stage and shield temperatures
chamber state/modes
holder types
Detectors
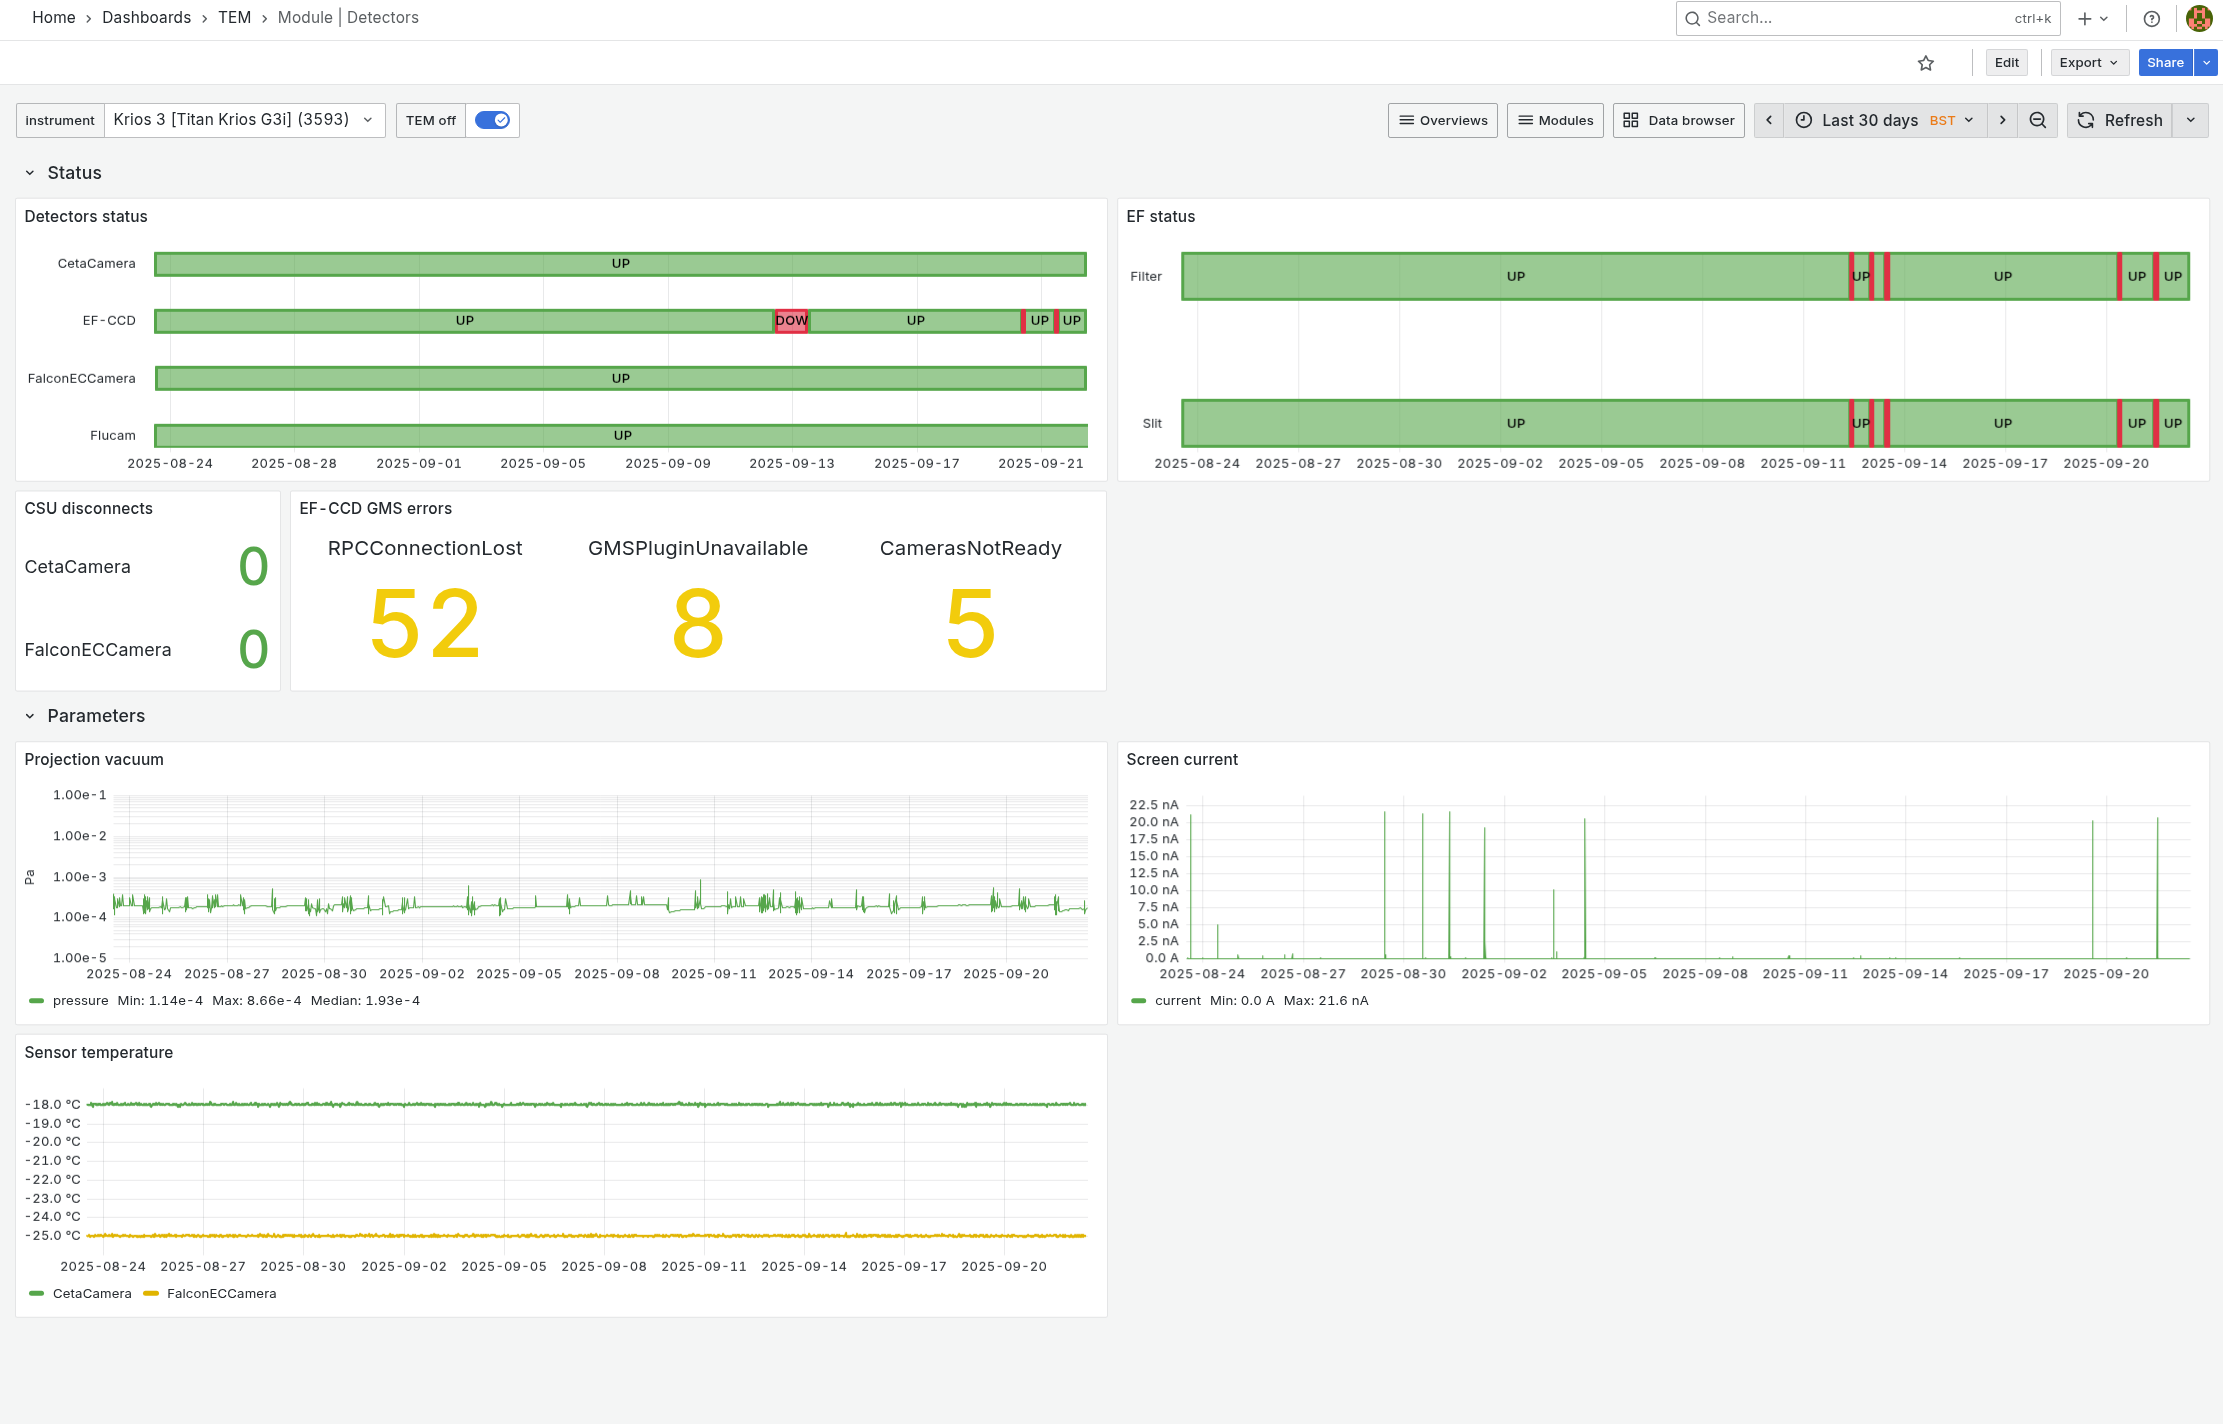
This dashboard monitors:
Overall status for each detectors
Sensor temperature for each detector
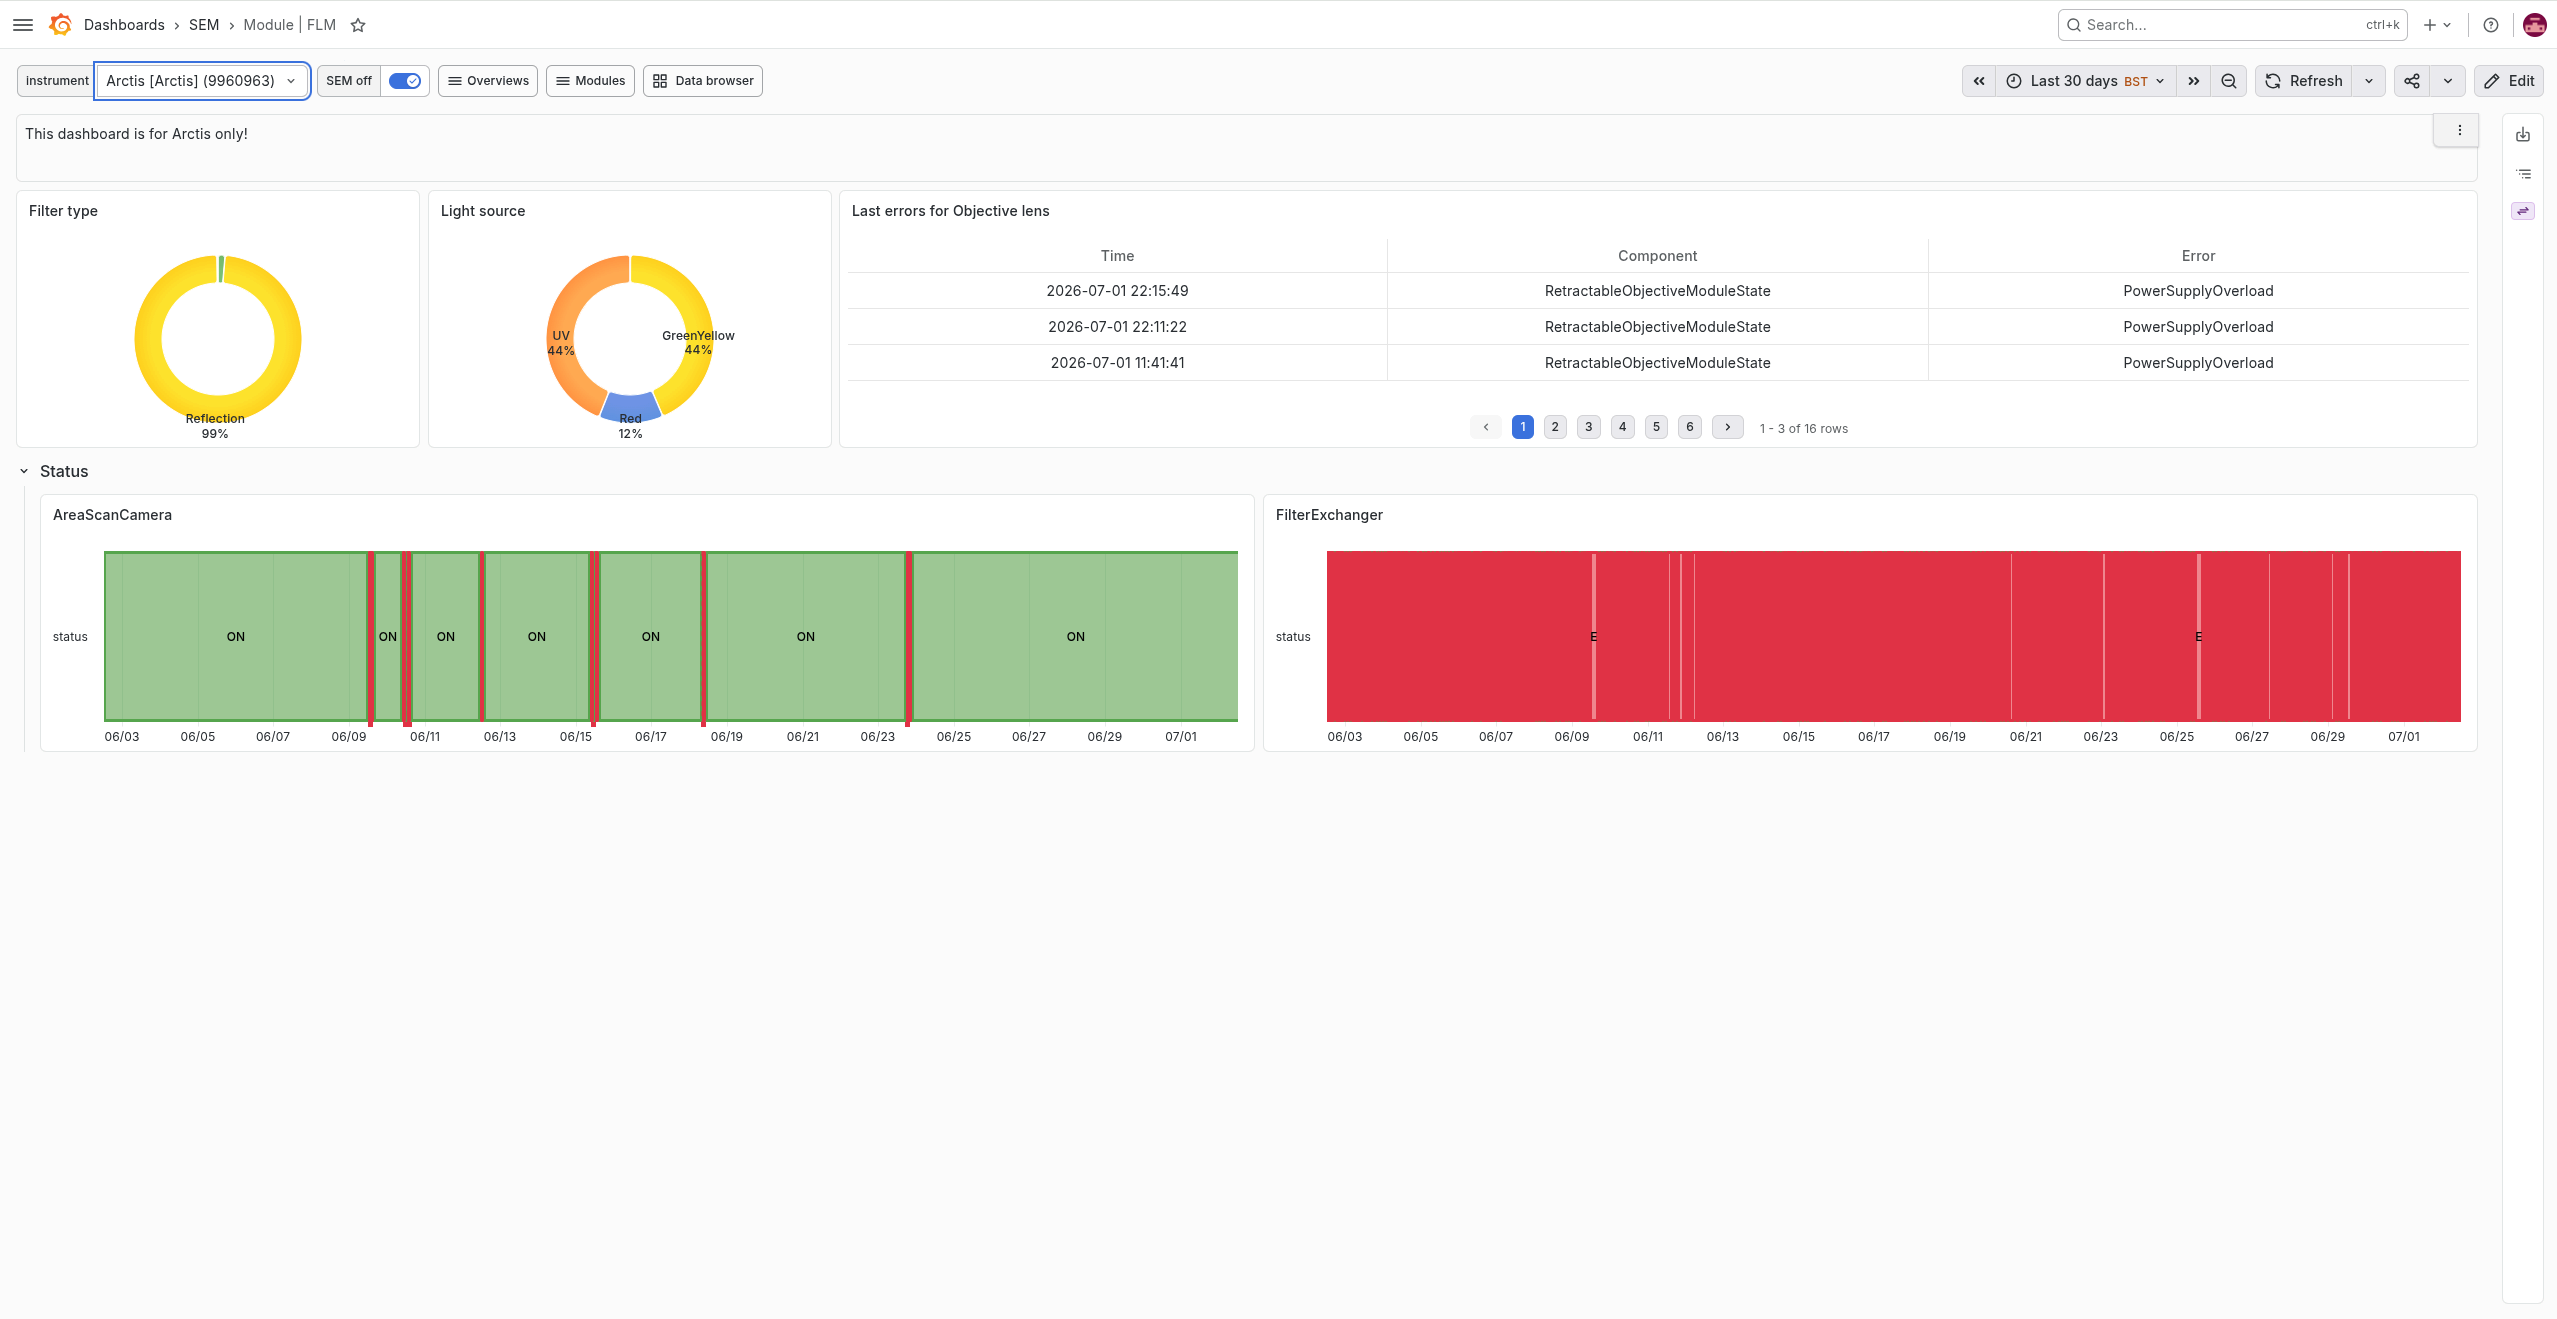
FLM
Arctis only dashboard which shows:
filter type used: reflection or fluorescence
LED type used: UV, Green/yellow or red
Objective lens errors
Overall status of area scan camera and filter exchanger
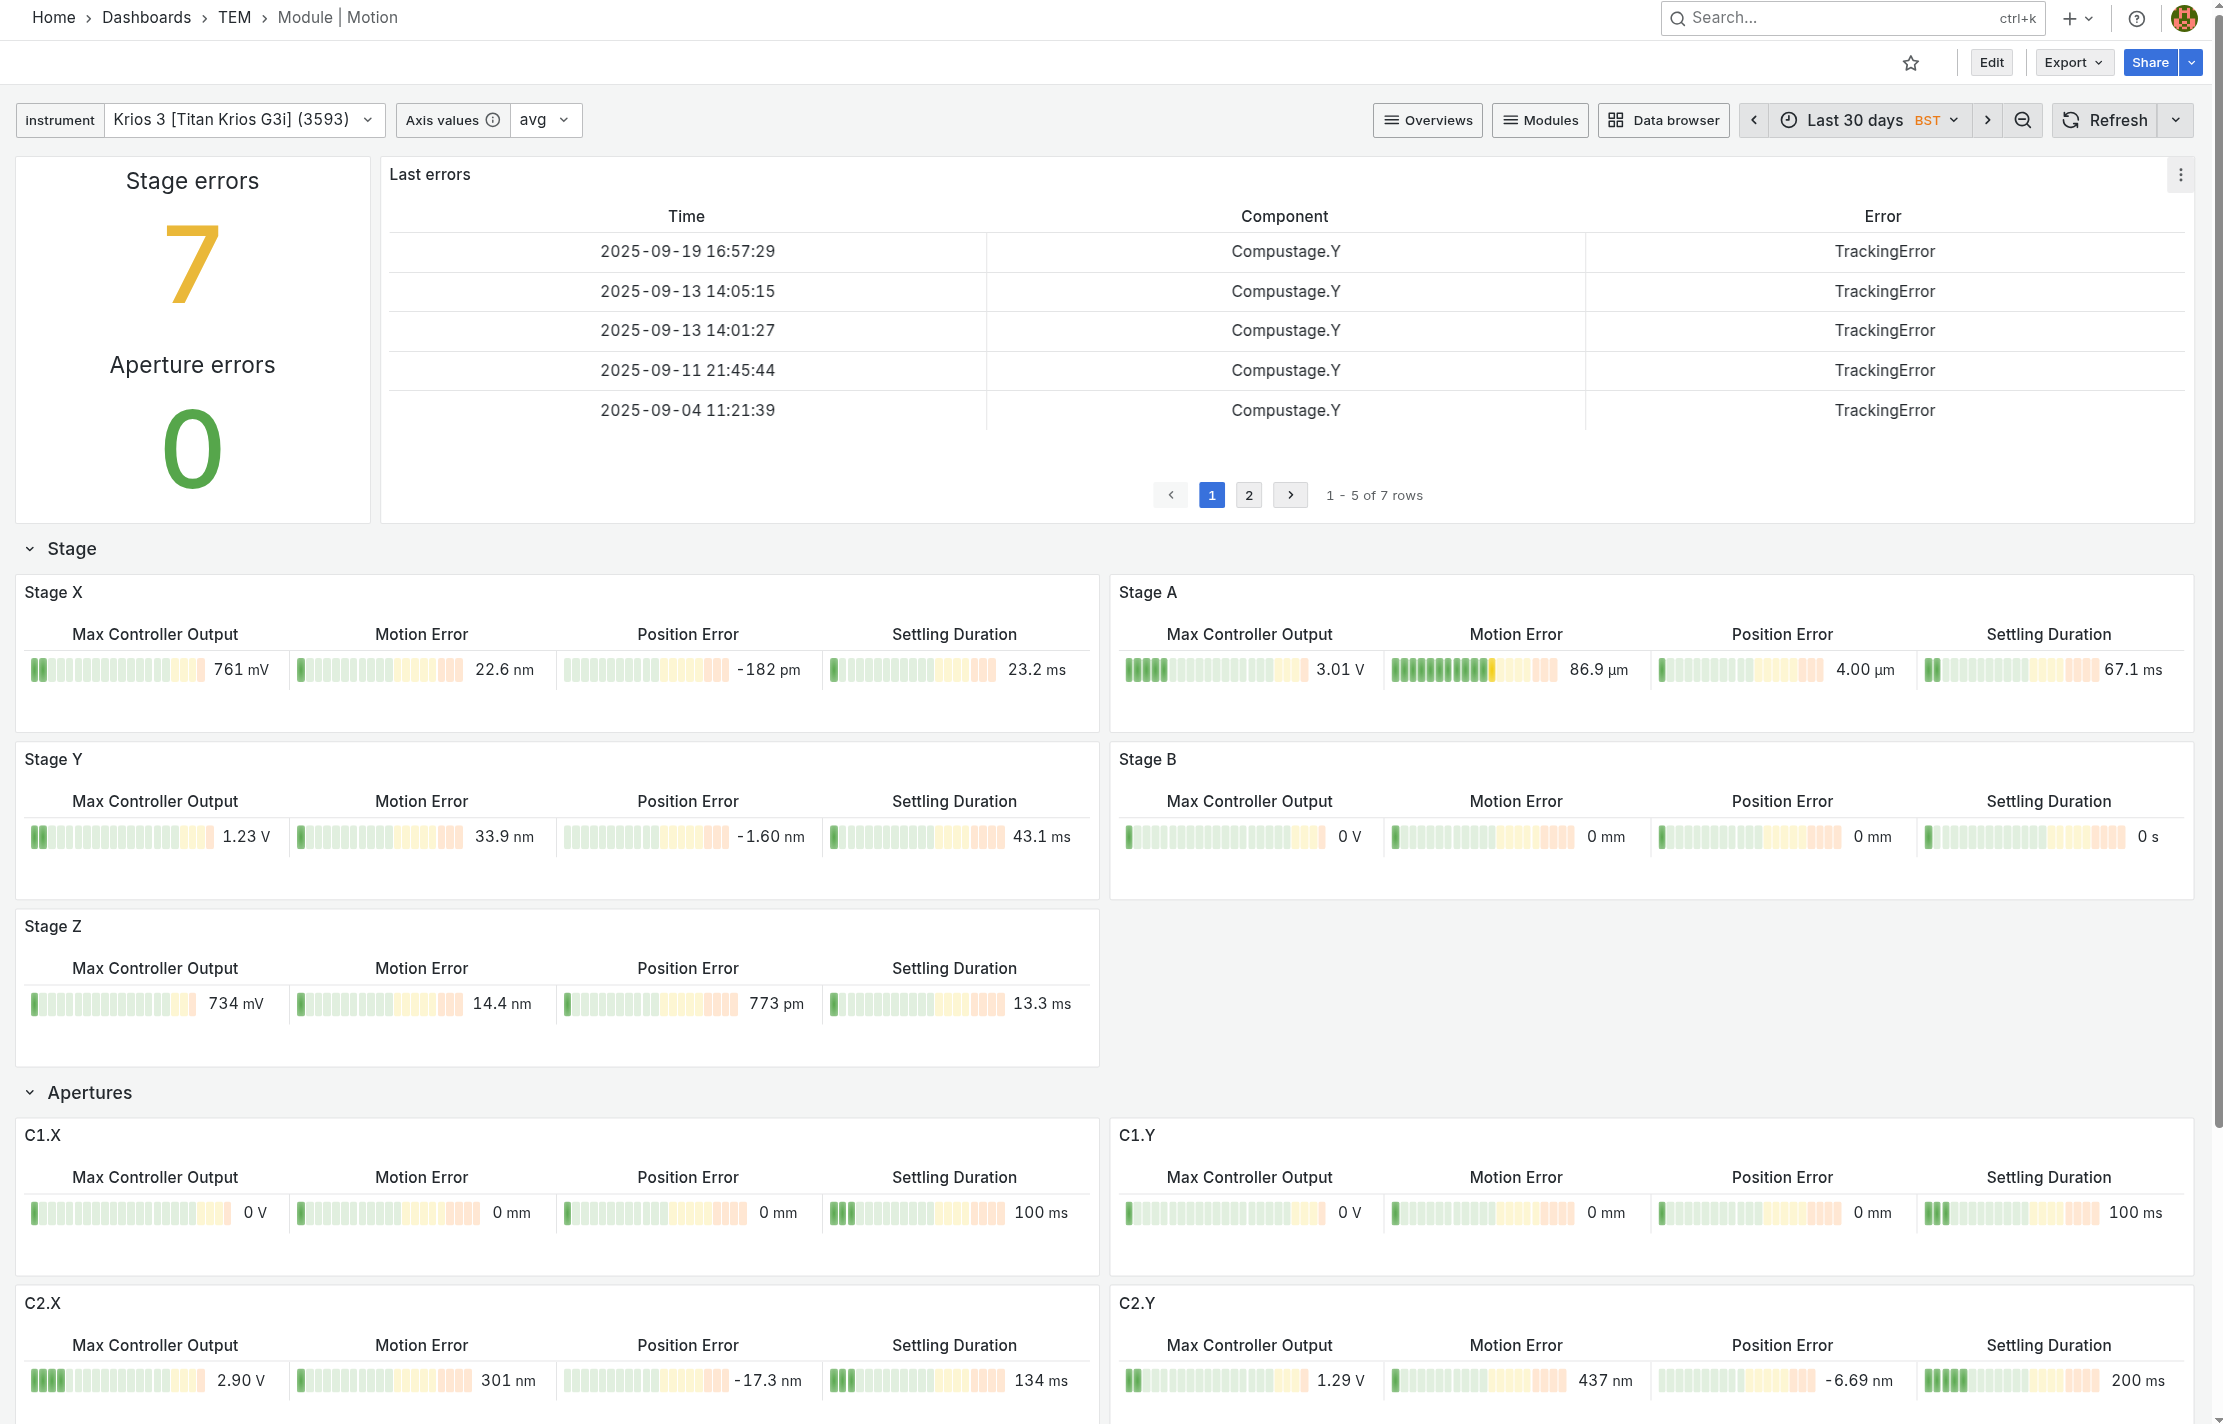
Motion
Tracks motion errors and reproducibility of axes movements for all stage axes and FIB/SEM apertures
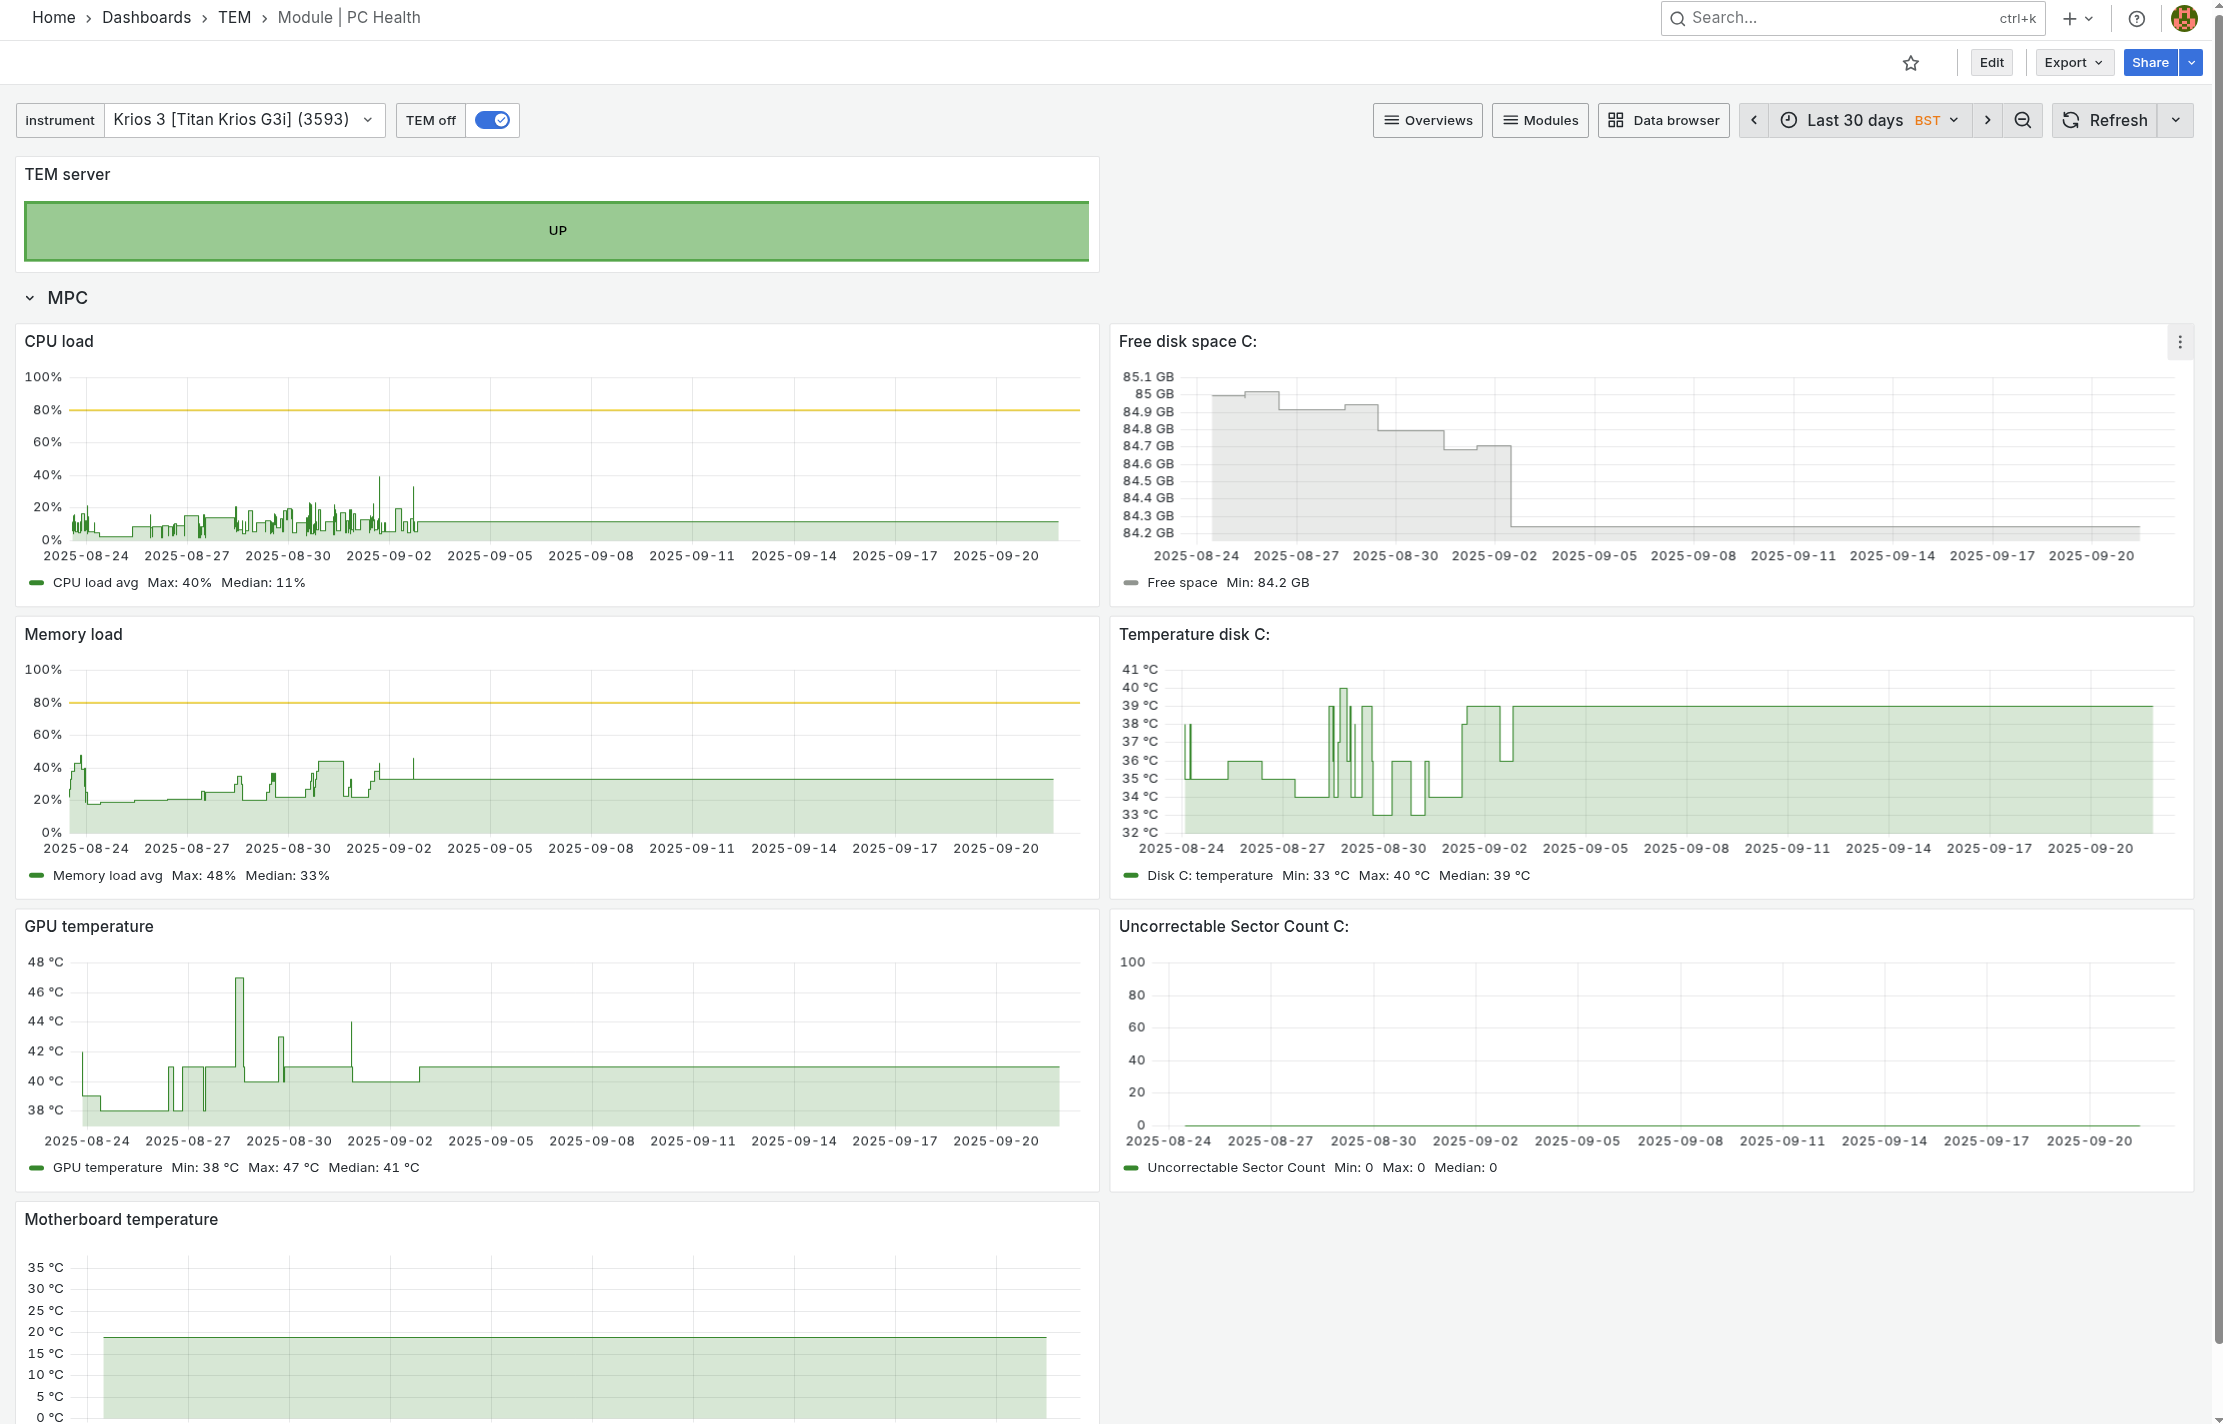
PC Health
Show xT server status and typical PC stats: CPU, memory load etc.
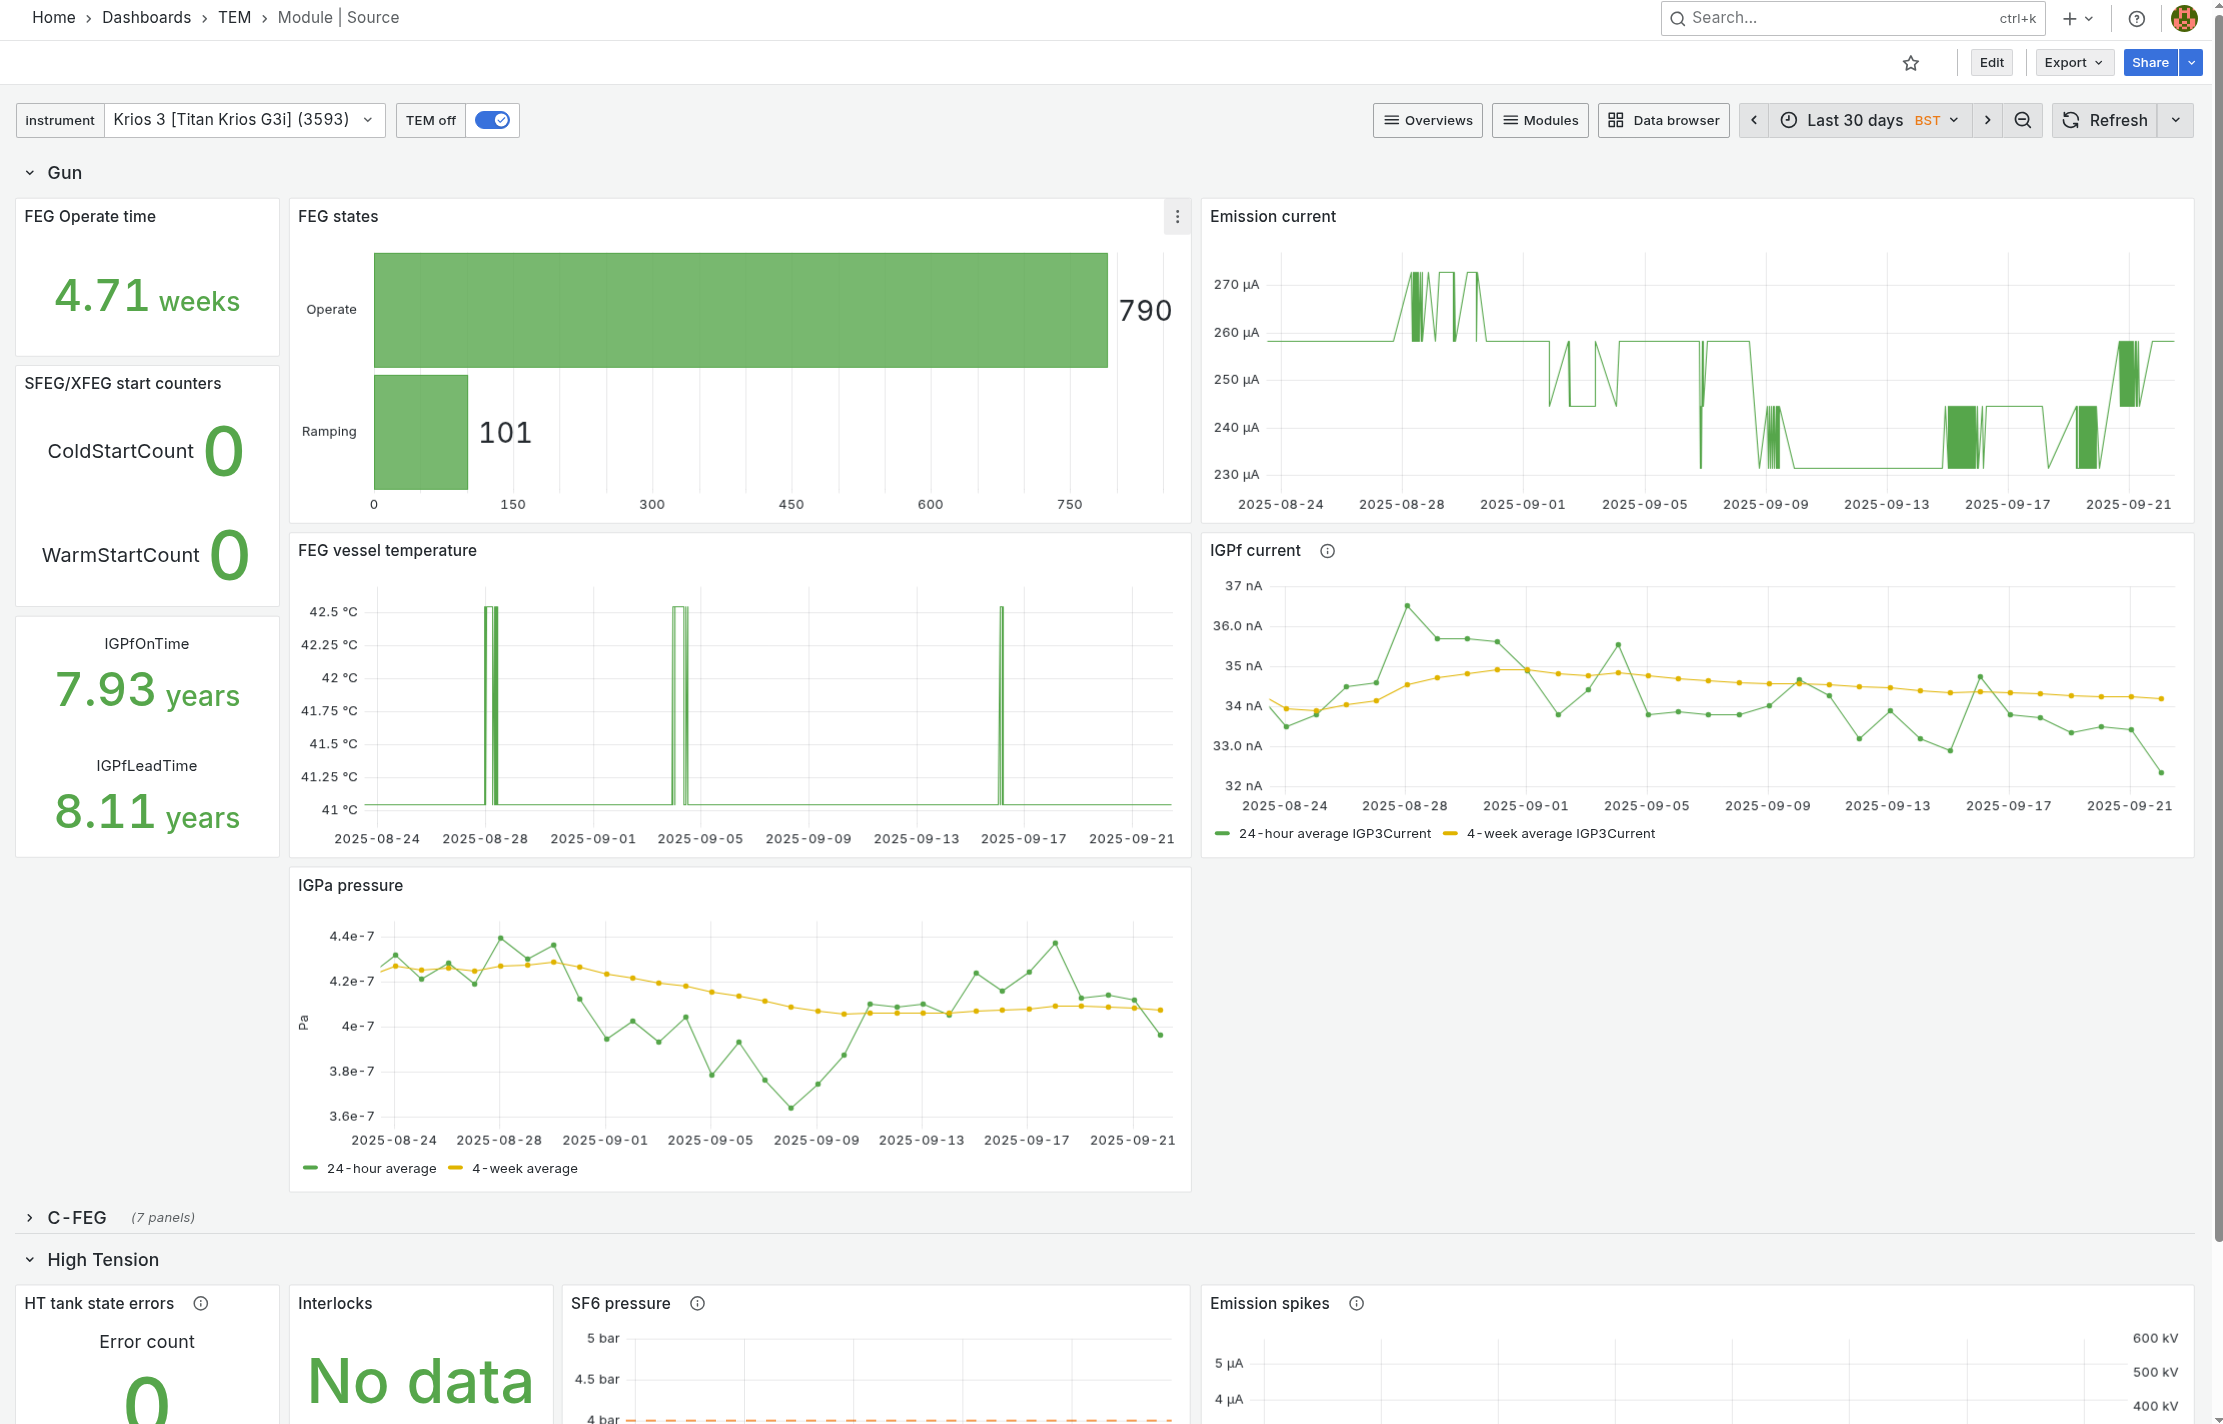
Source
Various parameters for FEG and ion gun are being monitored:
FEG operate time and states
IGP pressures
FEG emission current
Ion gun IGP pressures and spikes
LMIS/PFIB source age, last replacement date, heat cycles / ignition counts
LMIS emission current
PFIB gas usage, jacket flow and ignition ratio
Data browser
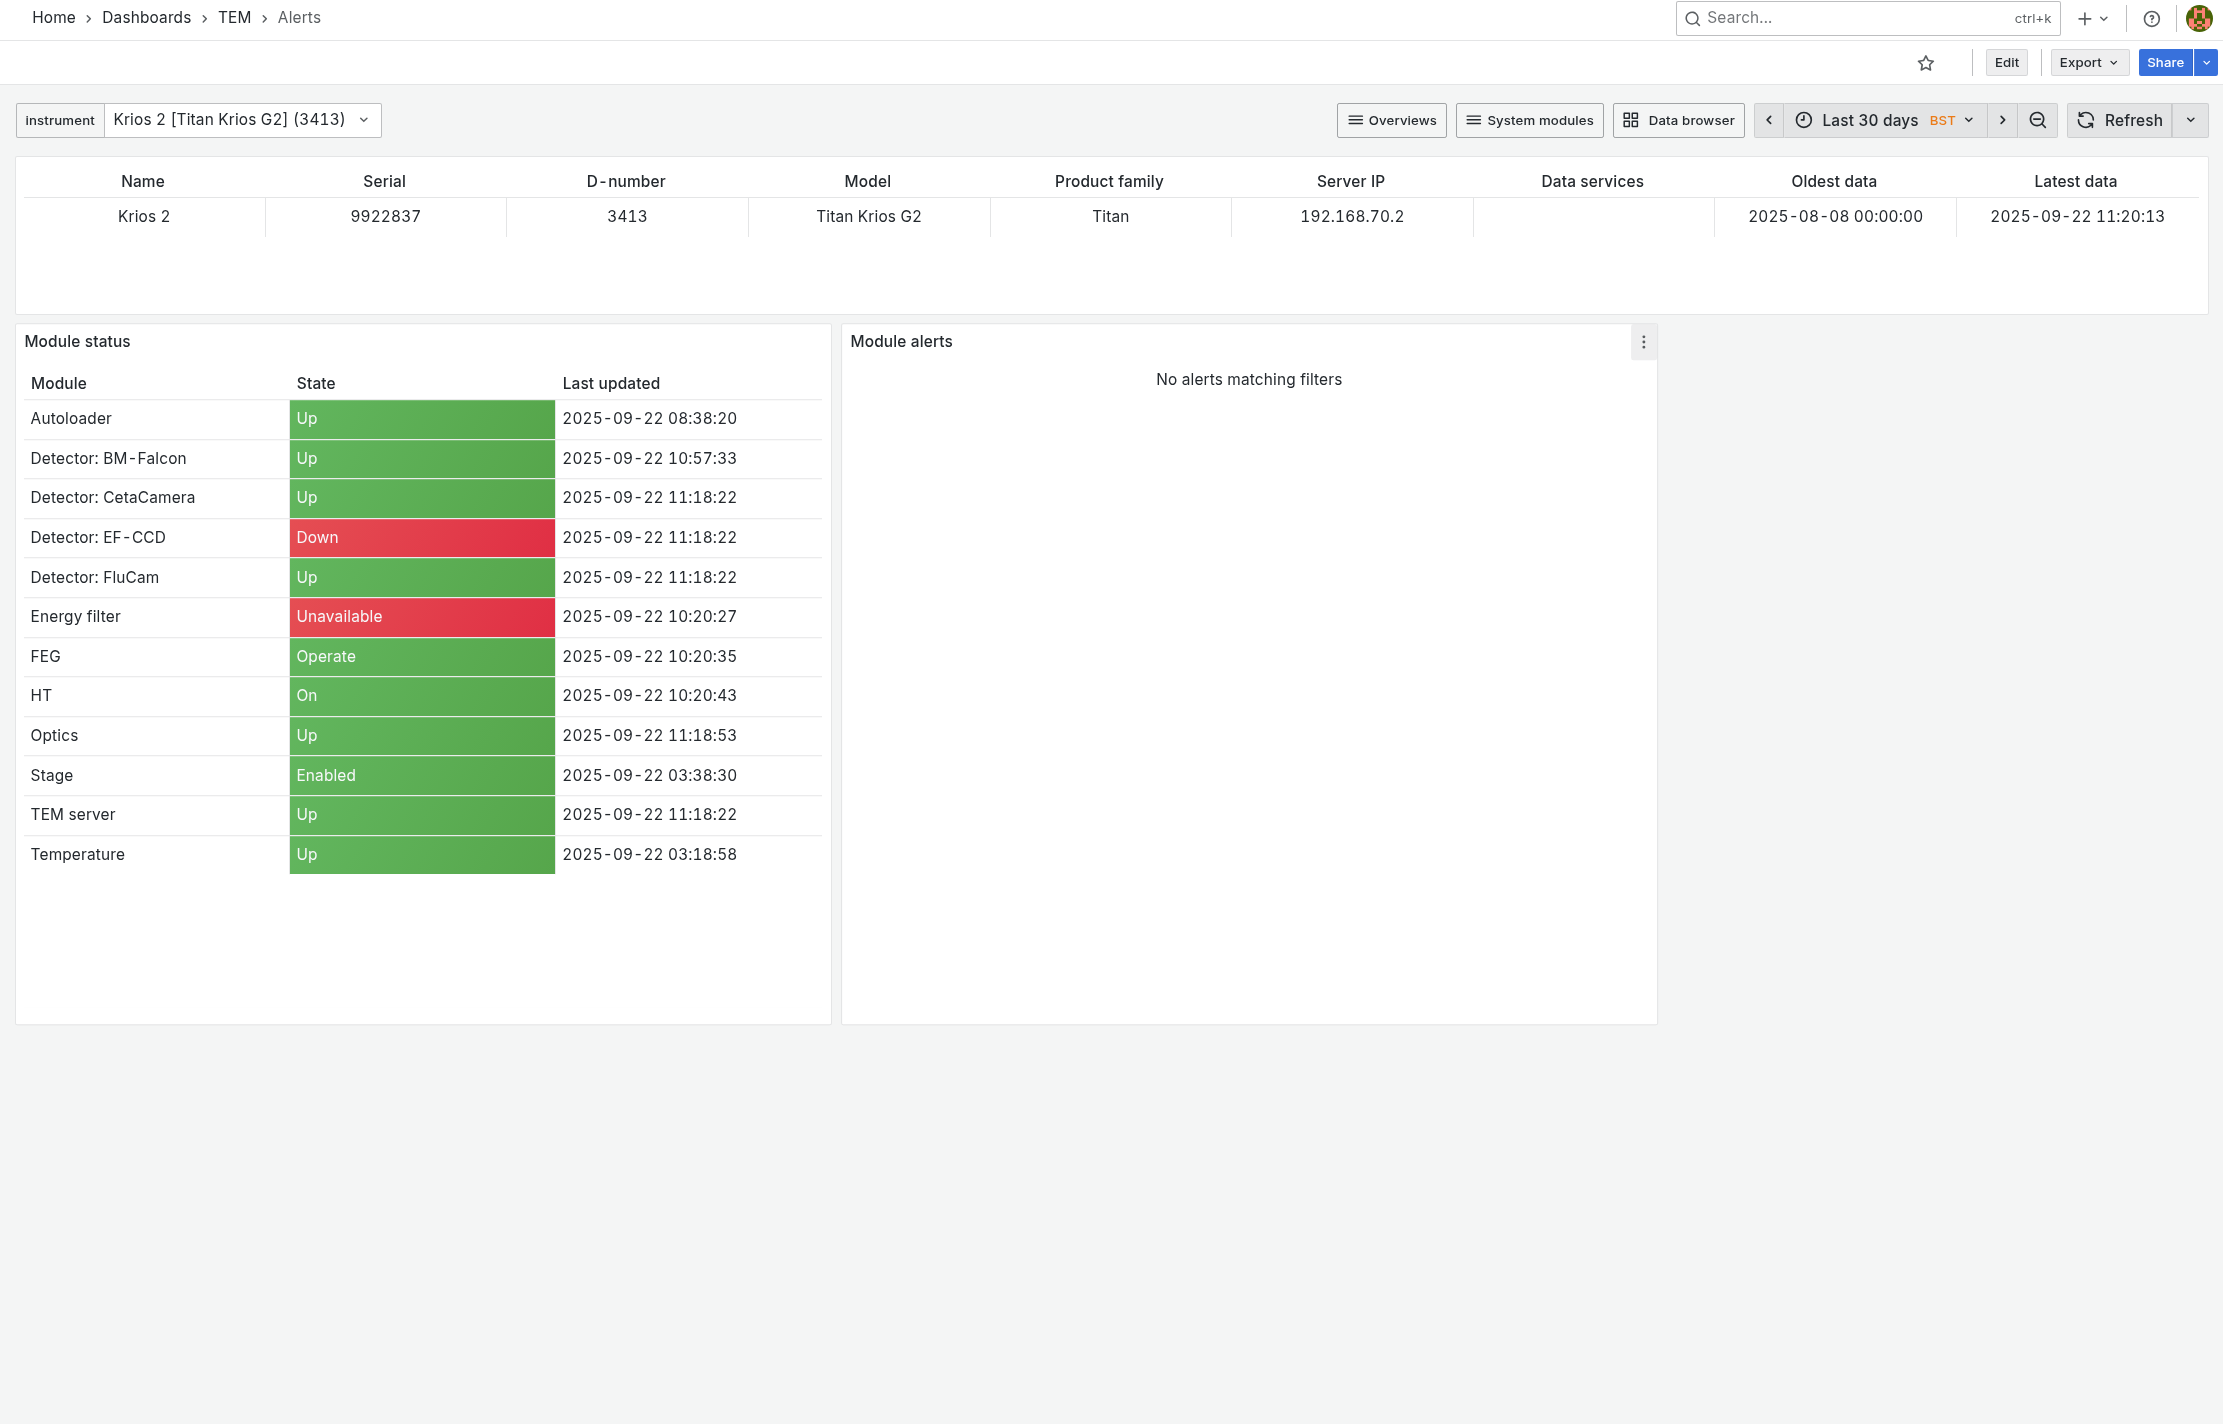
Mostly used for visualizing raw data from the database