Getting Started
FEI/Thermo Fisher Scientific (TFS) electron microscopes store instrument data using Data Services software on the microscope PC (MPC). This data includes event logging (Health Monitor), system configuration, alarms (error codes) etc. The Data Services backend uses Microsoft SQL Server (and PostgreSQL on new systems) with several databases.
Various applications like Health Monitor, FEI Viewer, UEC viewer, and D2i Data Collector access this data. Since the Data Services API is proprietary and TFS does not provide SQL server credentials, data can only be accessed through Health Monitor (HM). The HM client is typically installed on MPC and optionally on a support PCs, allowing connection to Data Services to view and export data in XML or CSV formats.
The EMHealth package provides functionality to:
Parse and import XML data into a TimescaleDB database
Visualize and analyze data using Grafana
Typical Setup
Windows PC (microscope or support) with:
Health Monitor client
Scheduled task for continuous data export to a location shared with Linux PC
Tip
A single Health Monitor client (e.g. on a support PC) can connect to different microscopes if they are all on the same network.
Linux PC running
EMHealthwith:
Access to the shared directory with exported files
Watchdog service monitoring modified XML files (provided by
EMHealth)Automatic data import pipeline (provided by
EMHealth)
Prerequisites
The software has been tested with data from the following systems:
TEM Glacios
TEM Titan Krios G1, G2, G3i, G4
TEM Tundra
SDB Scios
SDB Aquilos 2+
pFIB Arctis
Requirements for EMHealth package include:
It’s recommended to manage Docker as a non-root user, see details.
Installation
Set up Python environment and install the package:
conda create -y -n emhealth python=3.12
conda activate emhealth
git clone https://github.com/azazellochg/em_health
cd em_health
pip install -e .
Copy docker/.env_example into docker/.env and set secure passwords and tokens. Make sure BACKUP_DIR exists and has 777 permissions, since the containers need to write into this host folder. Detailed instructions can be found here.
Launch containers:
docker compose -f docker/compose.yaml up -d
or if you are running Podman
podman-compose -f docker/compose.yaml up -d
Data Import
After installation, you would typically import historical data for the past few months and then set up automated import of new data every 30 minutes.
Historical Data Import
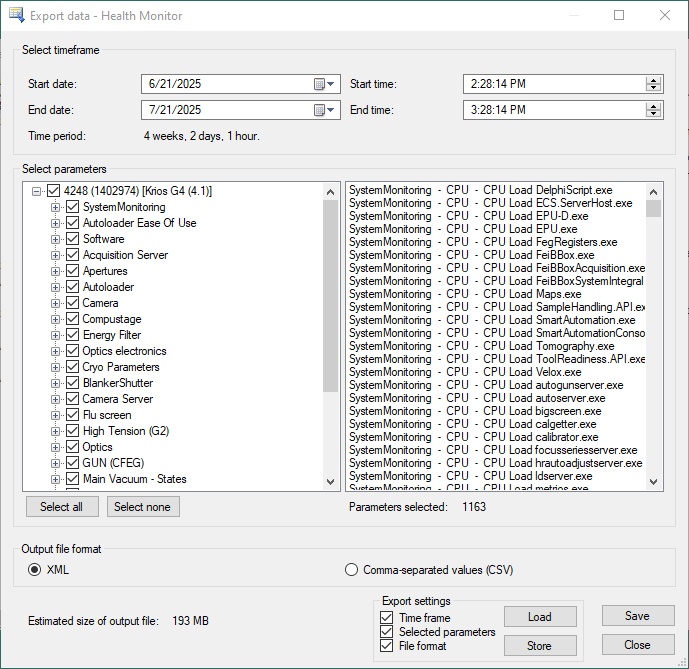
[Windows] Export XML data from Health Monitor (via GUI or CLI). Be aware, an instrument can have several associated DataSources (for HM, APM, AutoCTF, AutoStar, ToolReadiness, Velox etc). You need to select one that has Software->Server parameter.
Choose a date range, e.g. 1 month.
Select ALL parameters.
Format: XML
Press Save.
Note
If you select a very large date range, the export may fail. Also, new systems like Krios G4 have thousands of parameters, you should split export to several shorter time ranges.
Transfer file.xml to Linux PC and compress it using GZIP (gzip file.xml). This reduces the file size by over 10 times.
Configure instruments in instruments.json. See help for details
Run import (this may take a few minutes depending on the number of parameters and amount of data):
emhealth import -i /path/to/file.xml.gz -s em_health/instruments.json
If necessary, repeat export and import steps for other instruments.
Automated Import Setup
Generate Windows batch file for all instruments in the instruments.json file:
emhealth create-task -s em_health/instruments.json
Open export_hm_data.cmd and change OUTDIR value to a full path pointing to a shared location, available from Linux PC. Make sure the file name terminates with *_data.xml
[Windows] Copy the script to Windows PC. Create a new task in Task Scheduler to trigger the generated script every 30 min indefinitely. The script will keep overwriting the output xml files. See advanced setup for details
Note
The task will run only when a user is logged on. This is because in Windows the network drives are mounted on a per-user basis.
Start the watchdog service, which checks the directory every 5 minutes for modified files matching *_data.xml or *_data.xml.gz:
emhealth watch -i /path/to/xml/dir -s em_health/instruments.json -t 300
Post-Import Steps
Calculate initial historical statistics for the dashboards (run this step only once!):
emhealth db -d tem create-stats
emhealth db -d sem create-stats
Access Grafana dashboards at http://localhost:3000
Login with admin account
Navigate to “TEM” folder for instrument dashboards