DB performance dashboards
This set of dashboards is inspired by Pganalyze and collects the statistics from existing TEM and SEM databases.
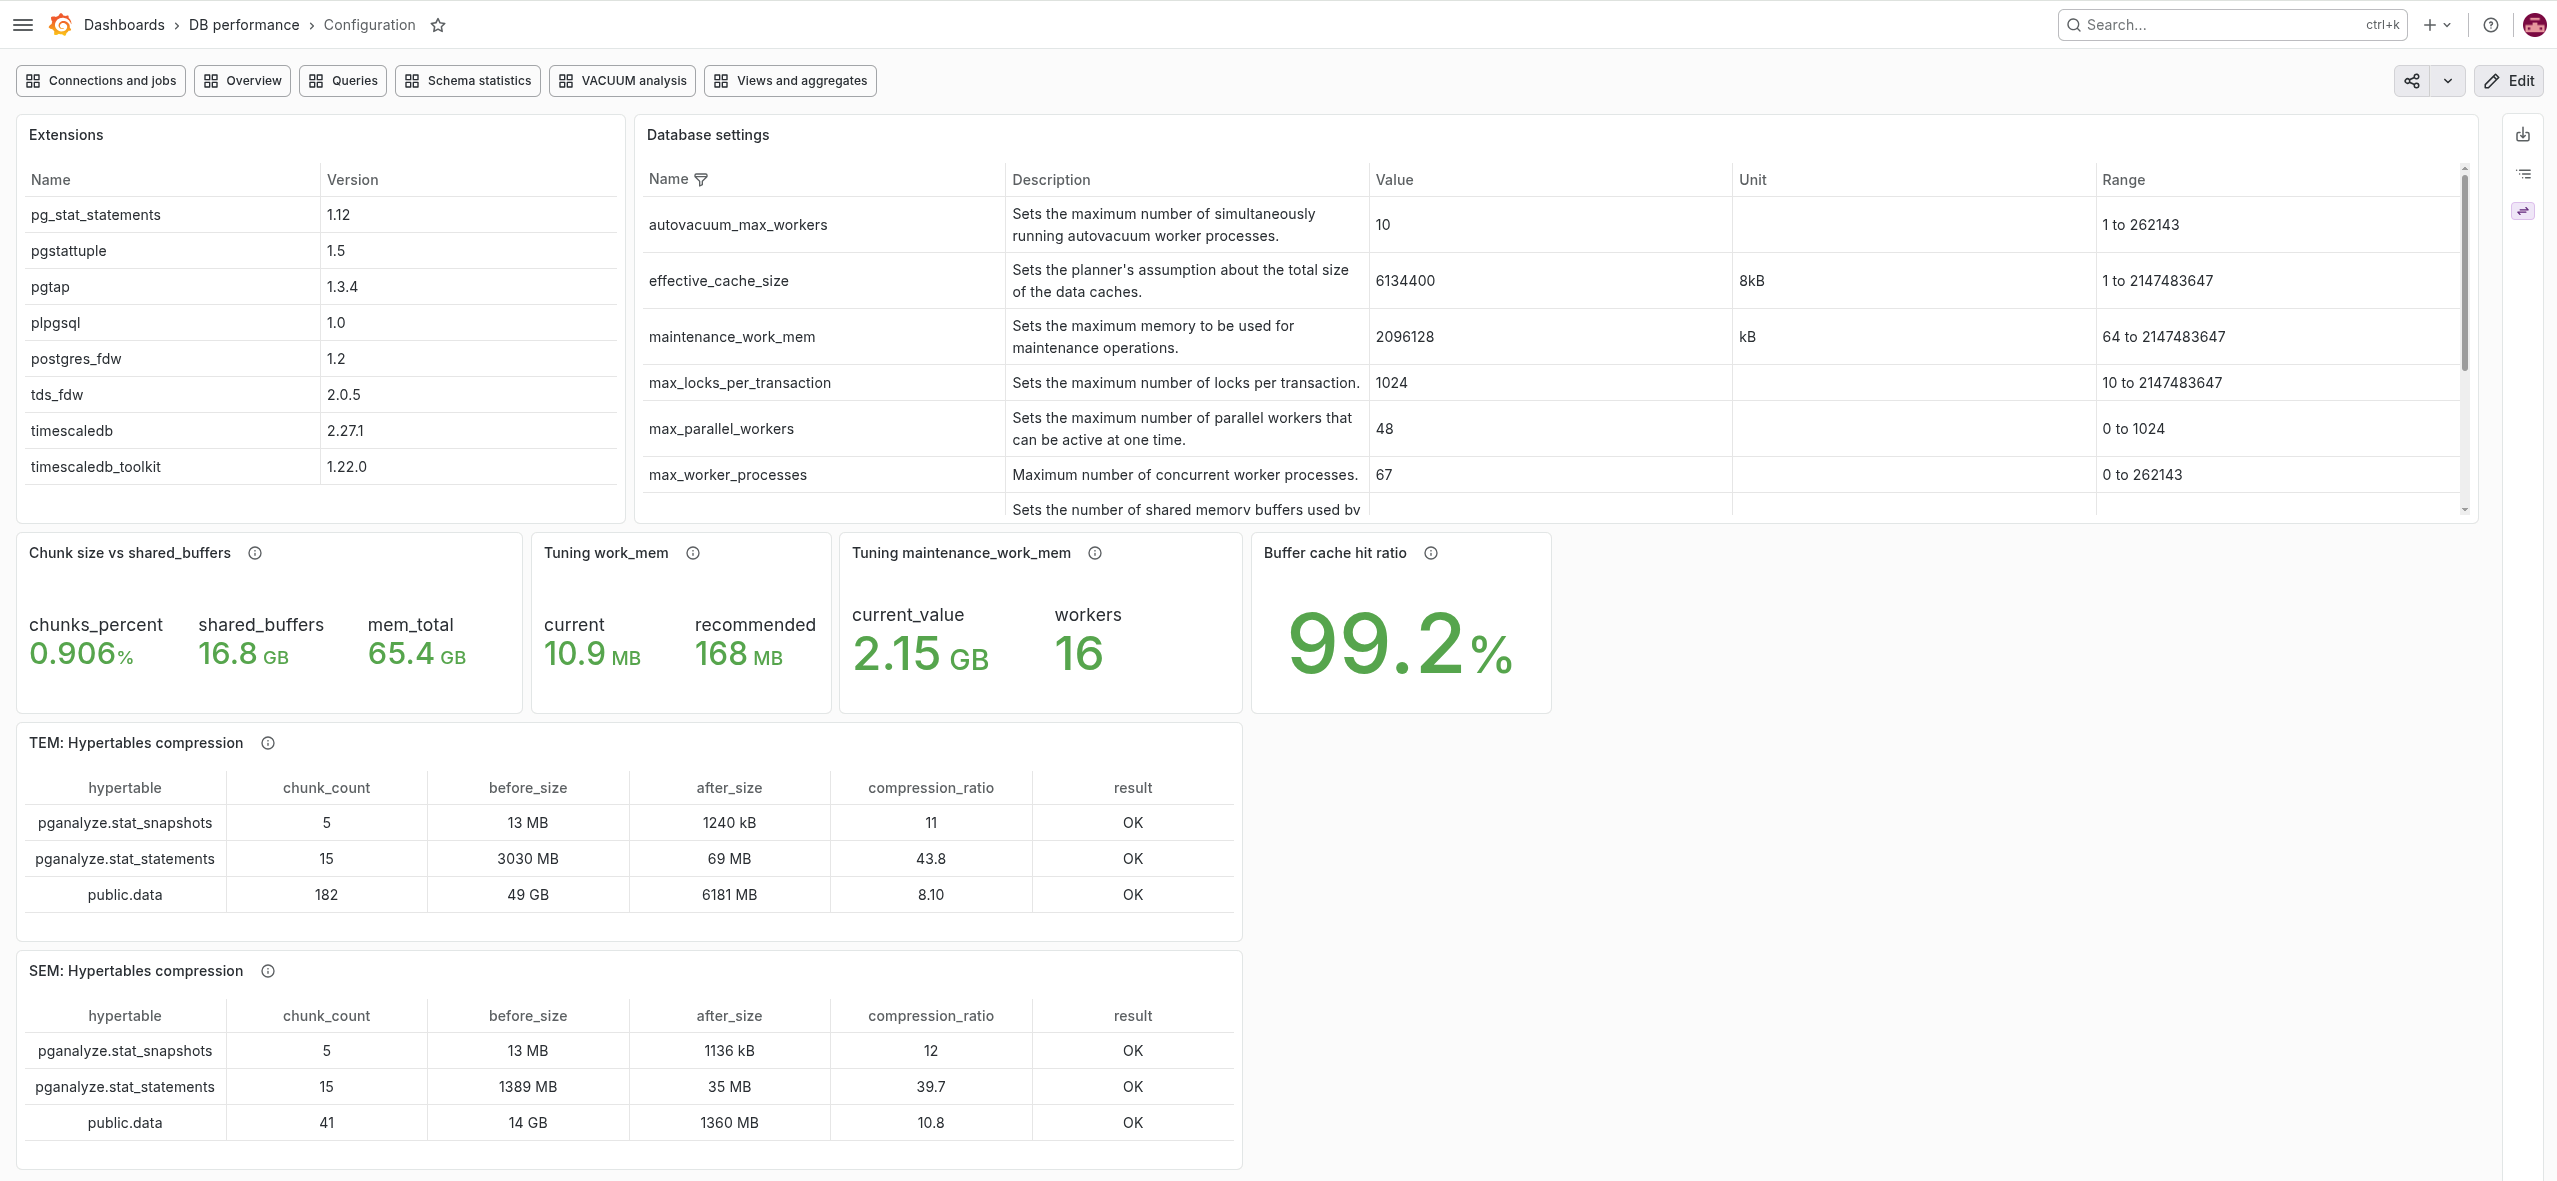
Configuration
list of PostgreSQL extensions
database configuration options
recommended TimescaleDB settings
hypertables compression performance
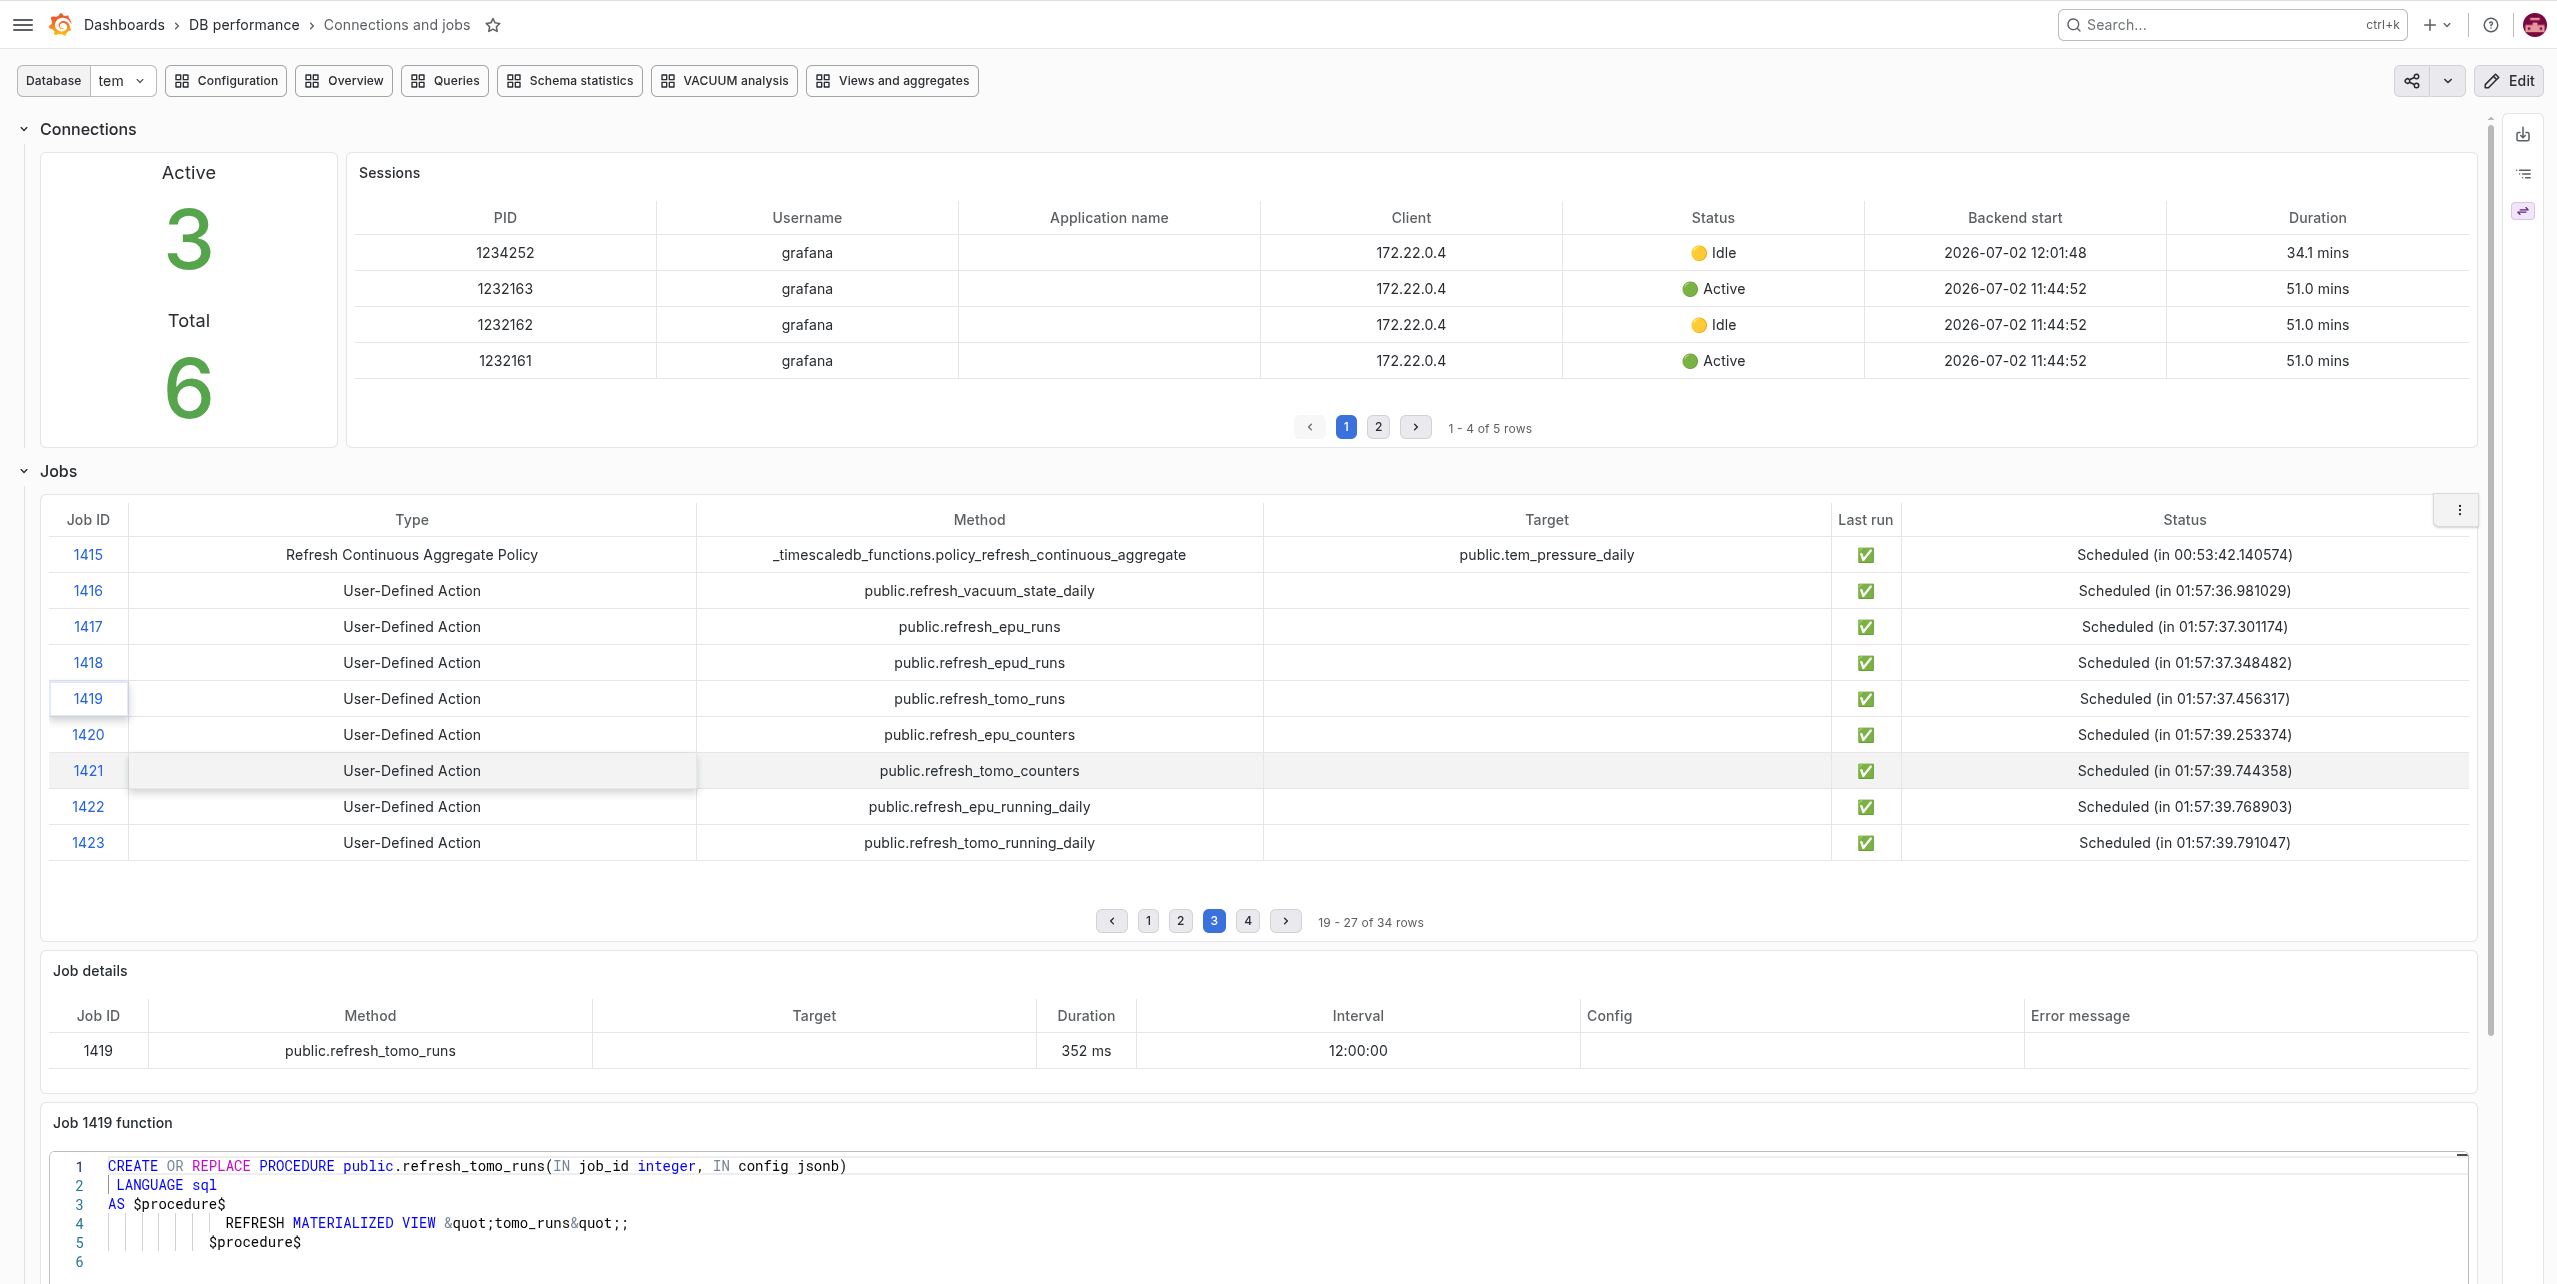
Connections and jobs
active connections to the database
TimescaleDB scheduled jobs details and status
for a selected job, you can display its schedule and function description
Overview
server status, uptime and version
CPU and RAM utilization
database size, TimescaleDB rowstore vs columnstore
queries runtime (average execution time per call)
tuples and transactions rate
WAL size, locks and temp files
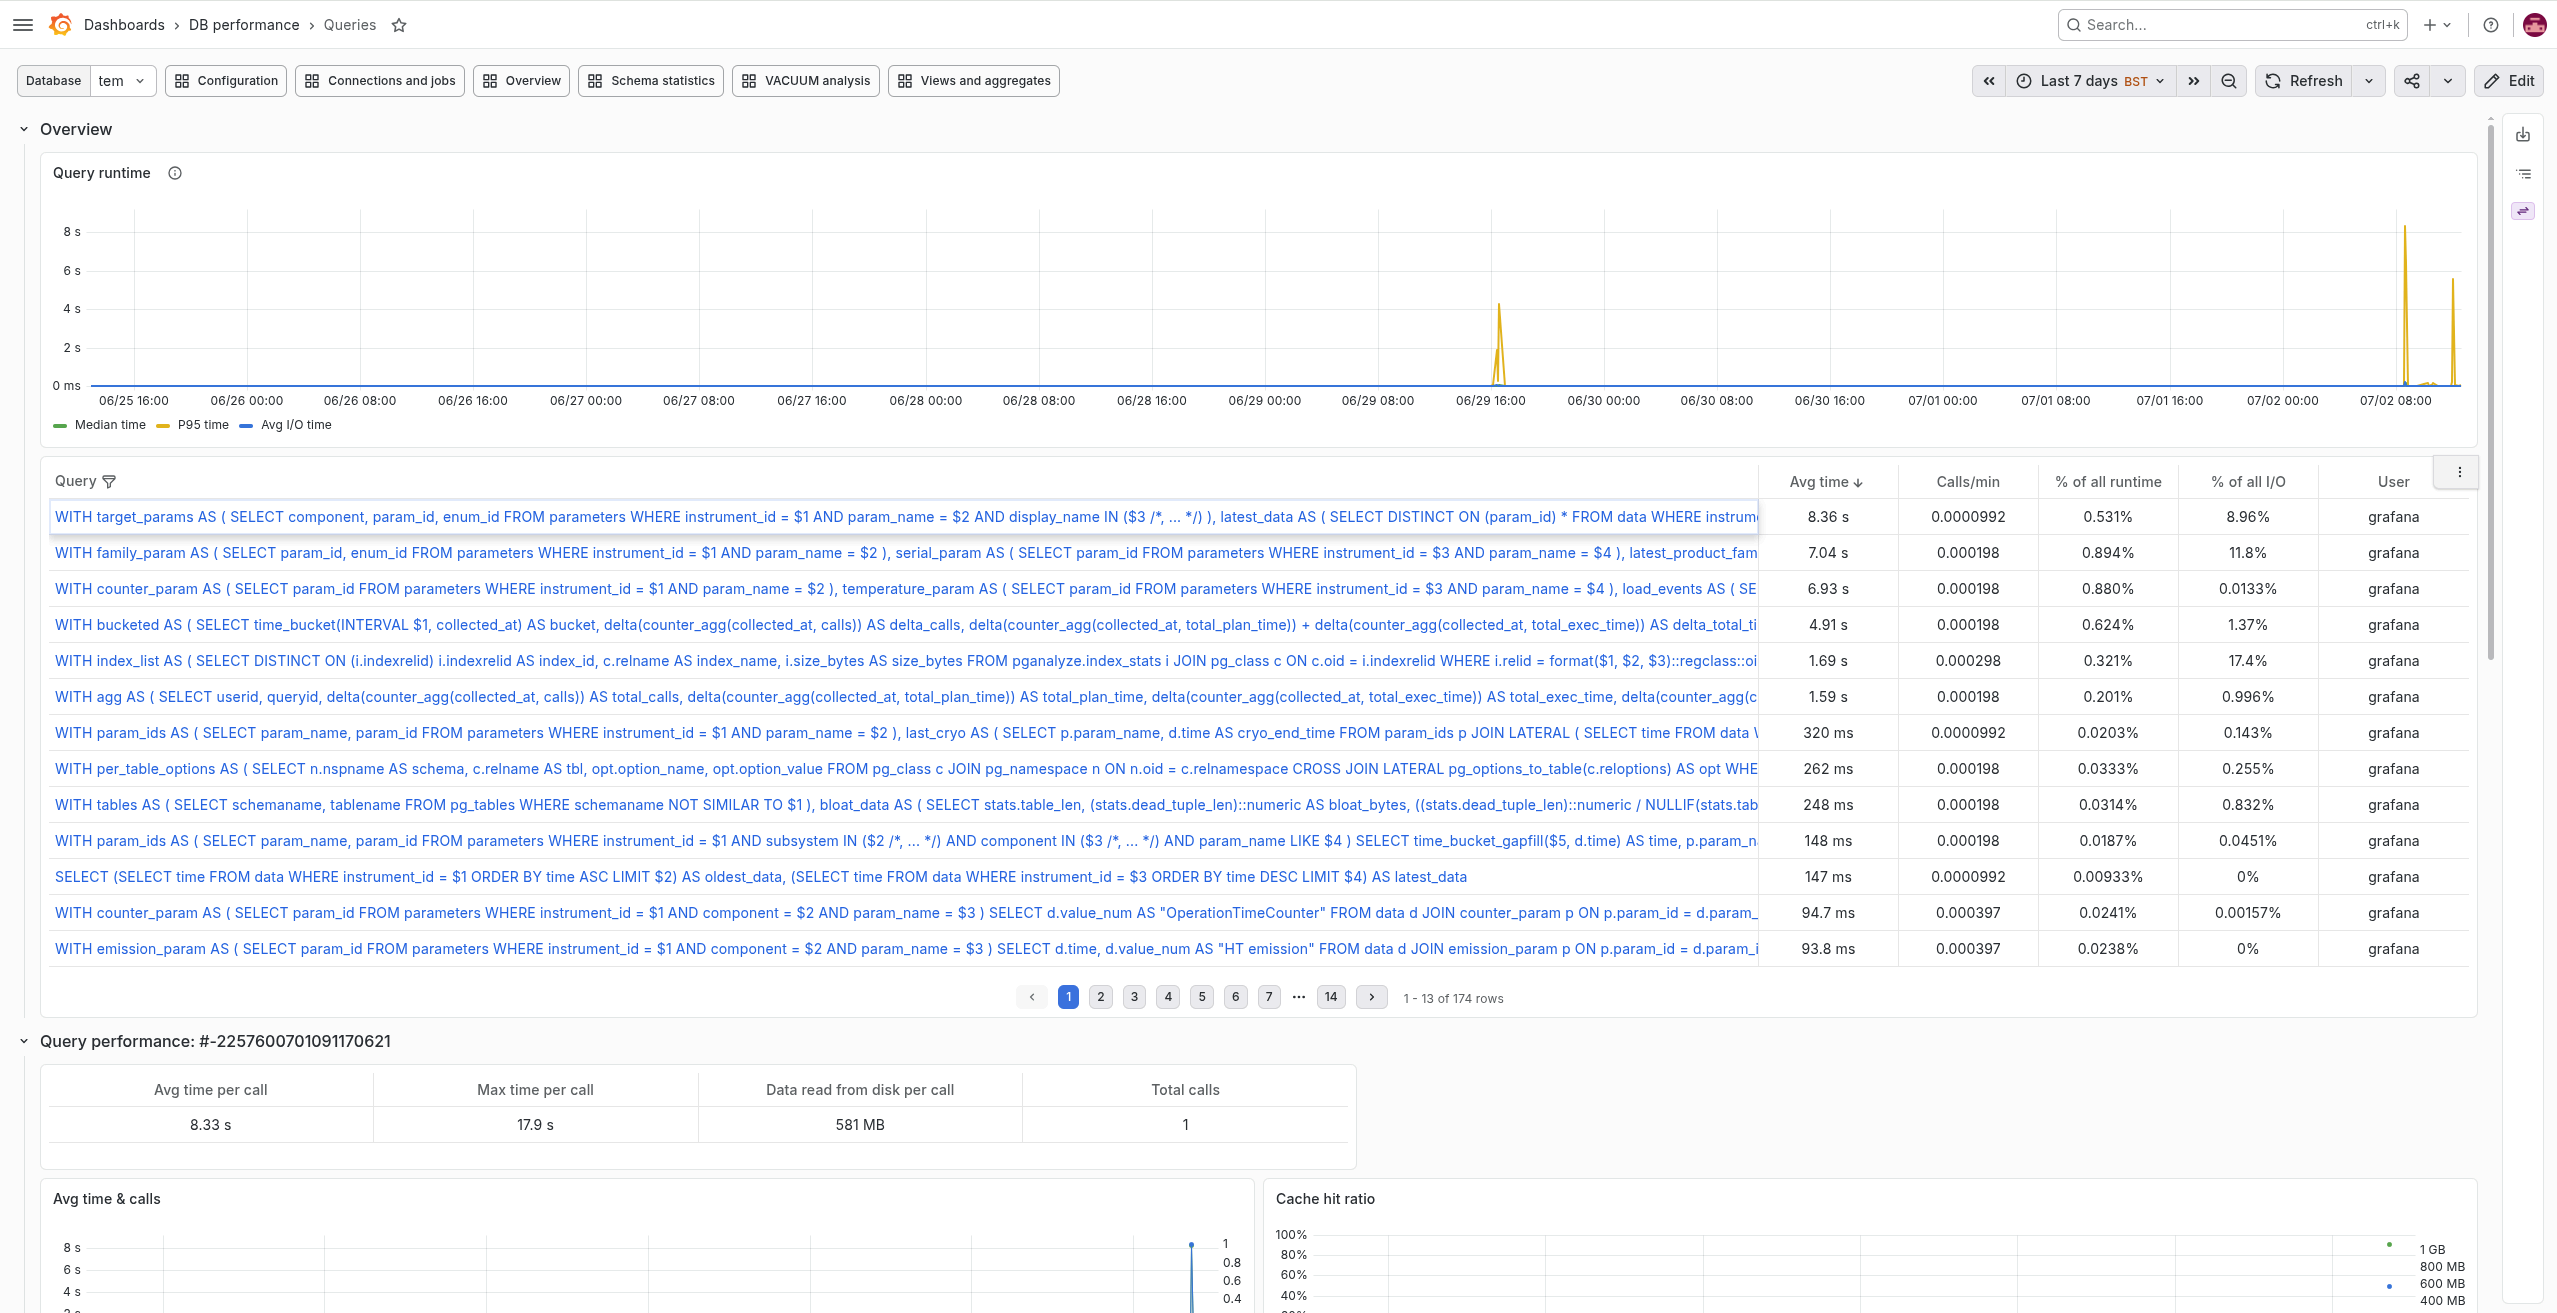
Queries
queries runtime (per call statistics over time)
queries table with calls and I/O stats
individual query statistics
EXPLAIN plans for longest queries
Schema statistics
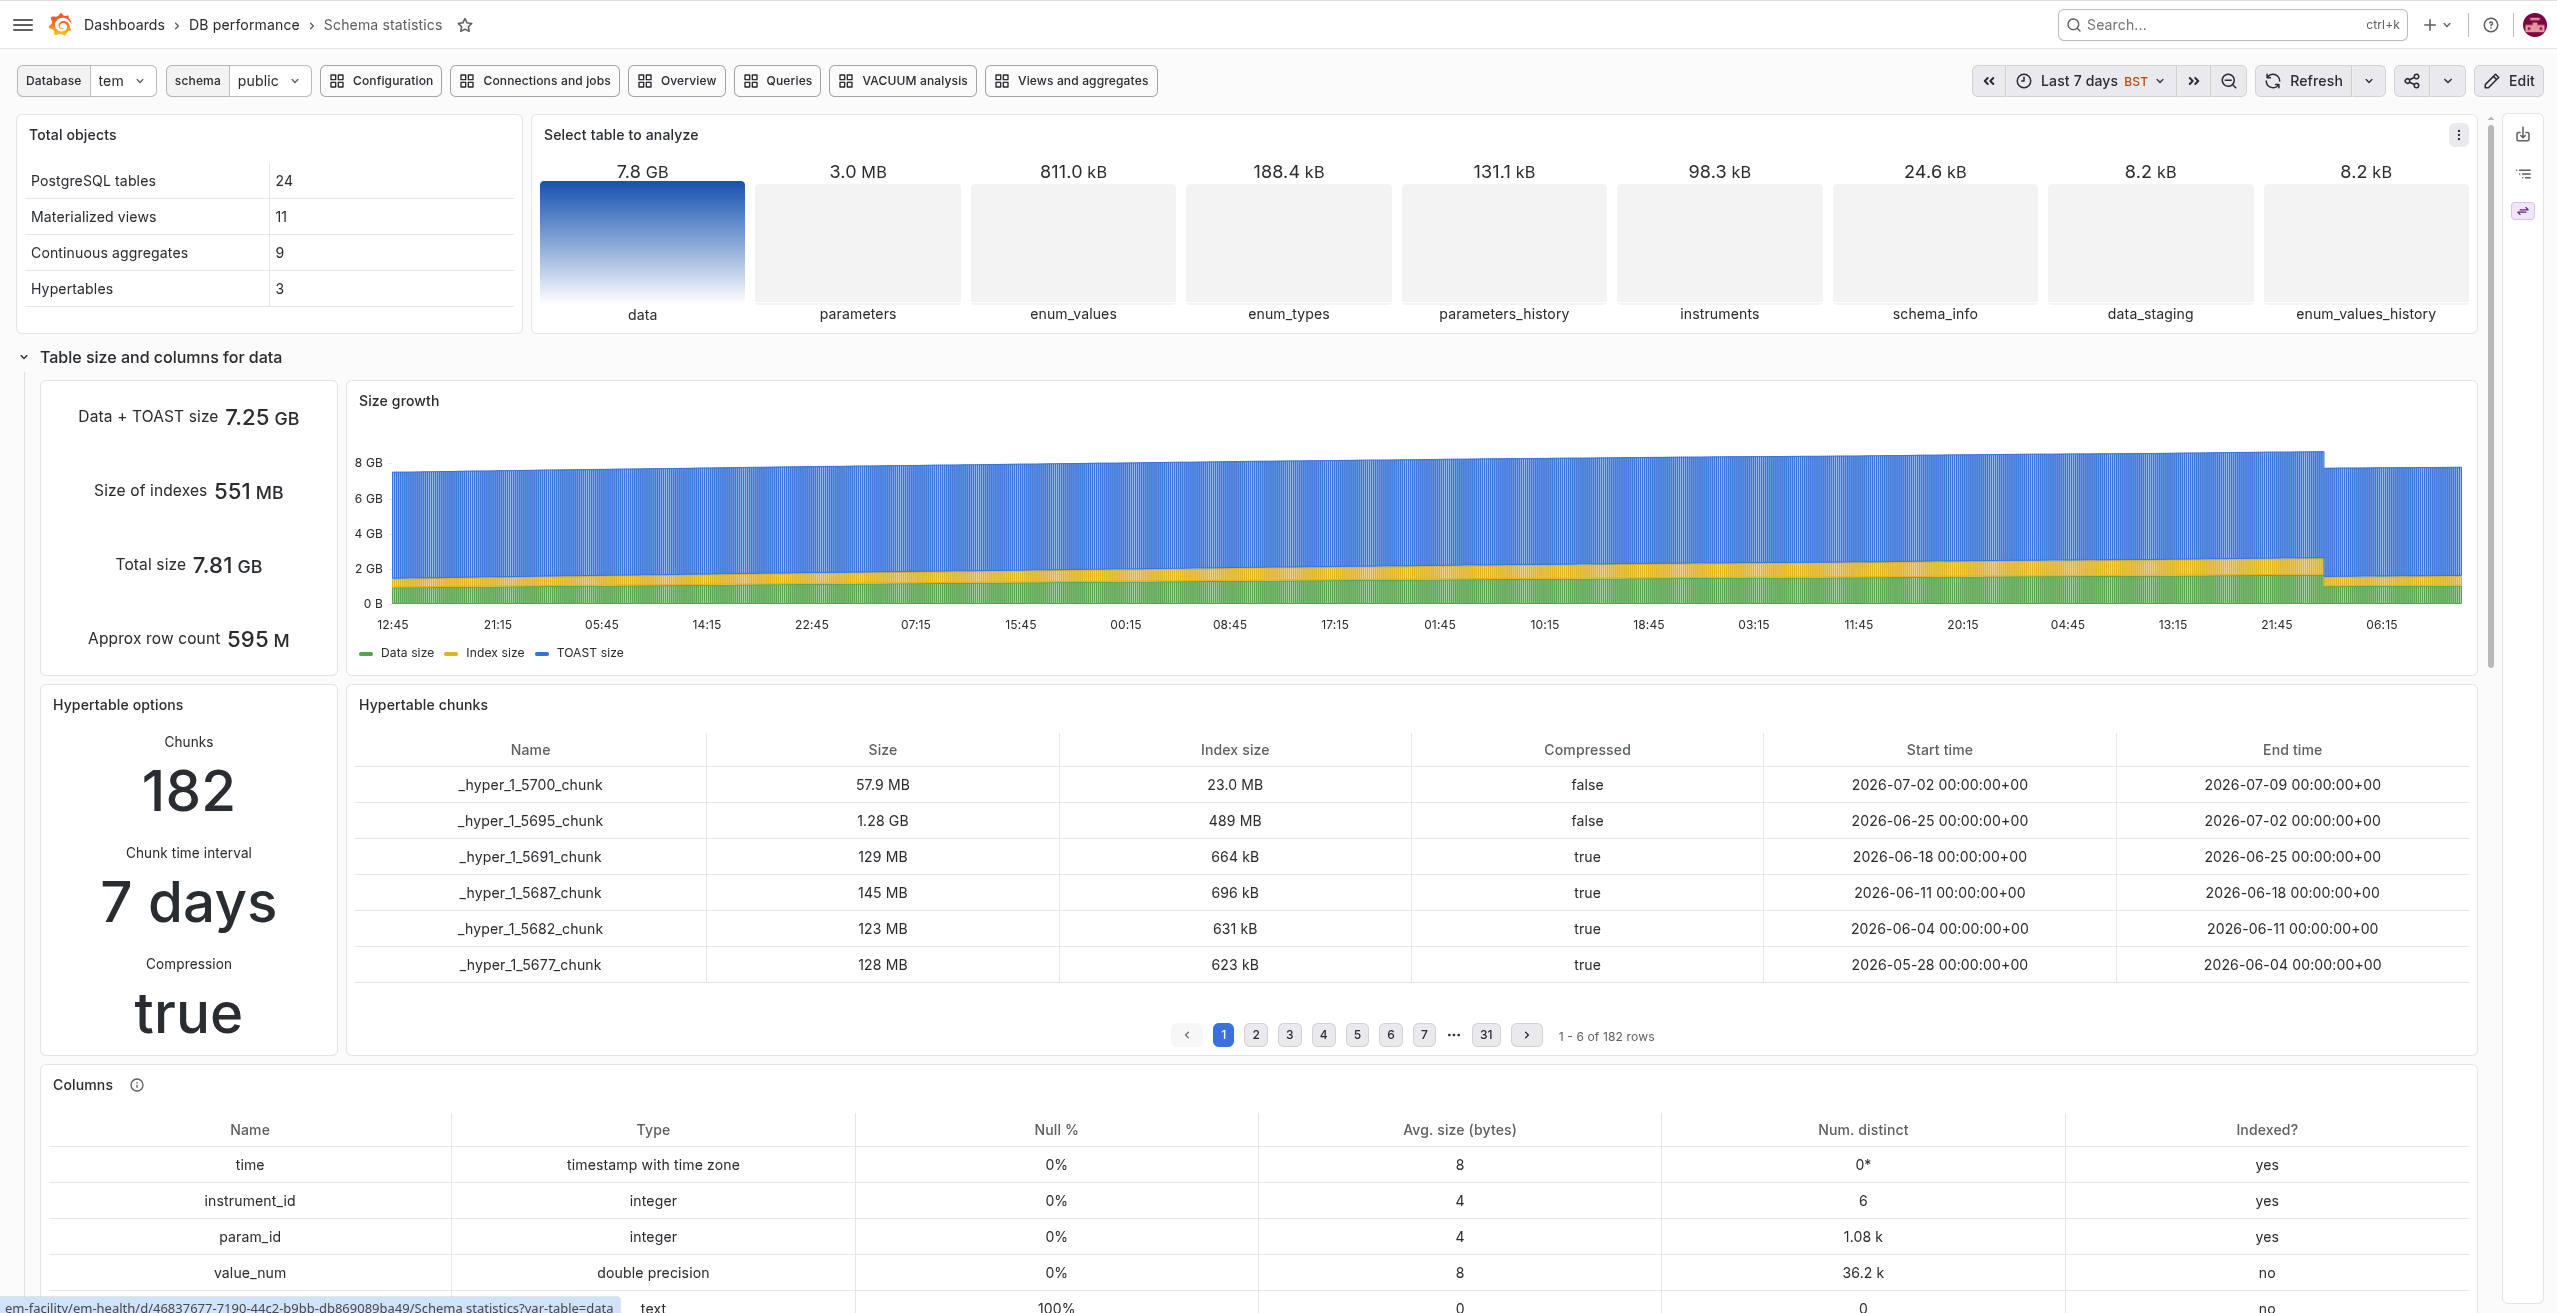
total number of tables, views, aggregates and hypertables in the database
size, columns and chunks statistics for a selected table
indexes for a selected table and their utilization (scans, hits and reads)
table vacuums and dead rows time series
VACUUM analysis
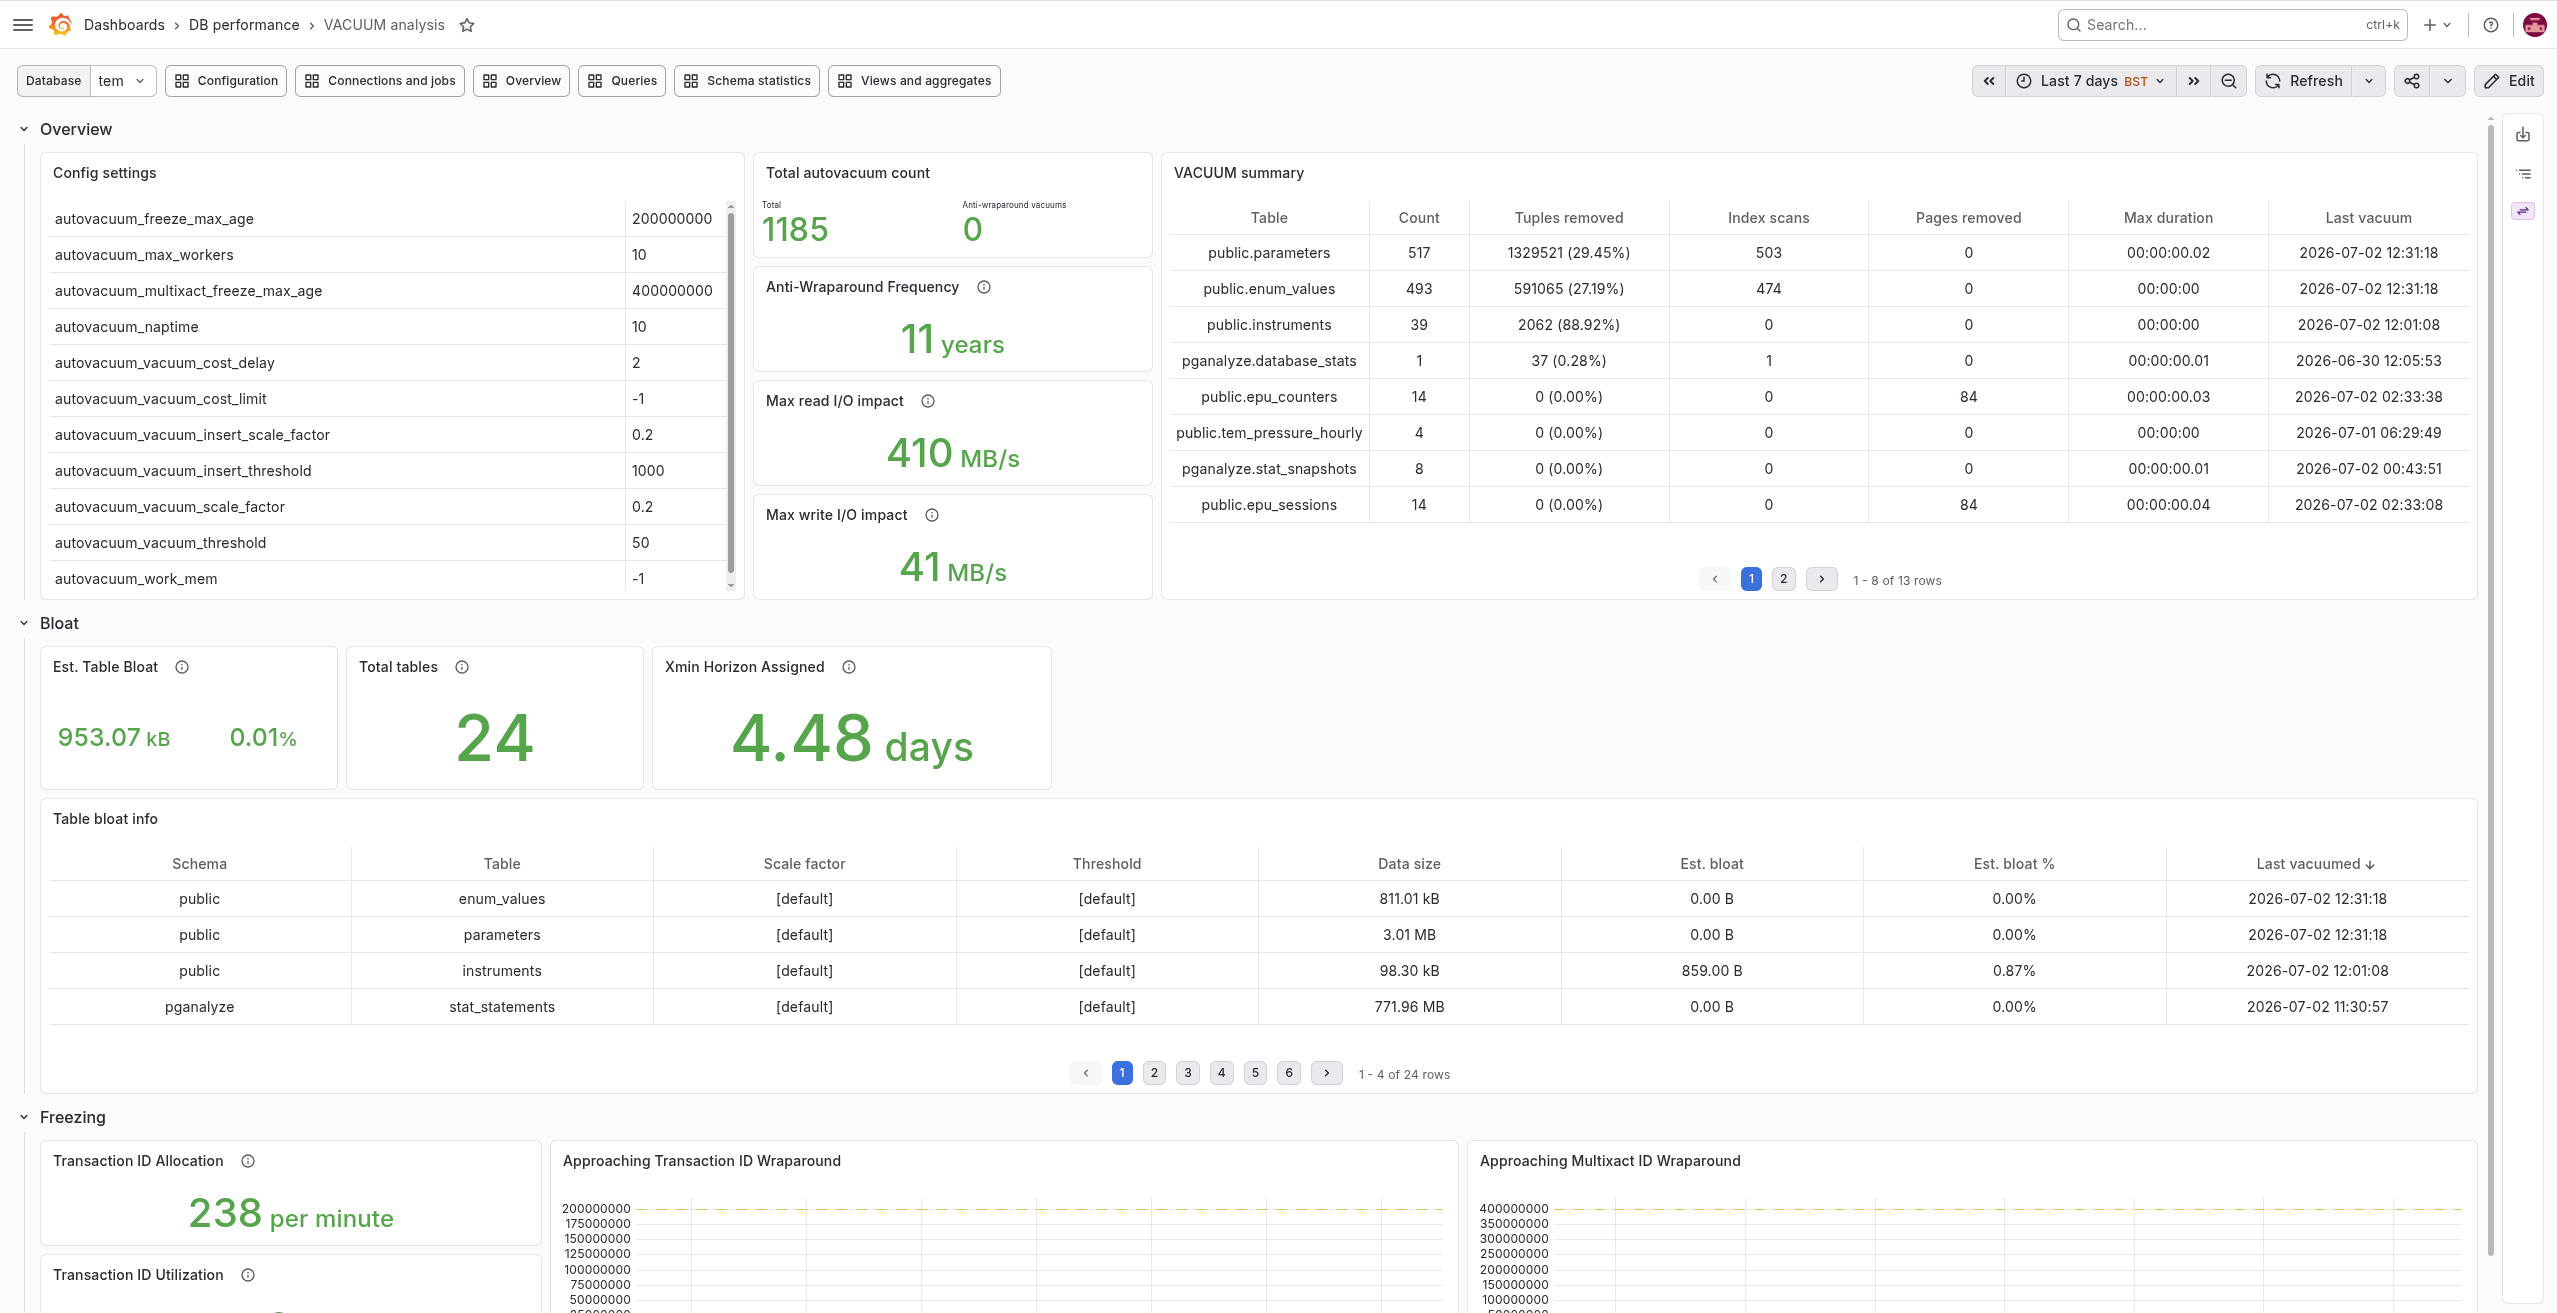
PostgreSQL autovacuum settings
vacuum counts and other stats for each table
table bloat estimation
transaction IDs stats to estimate freezing
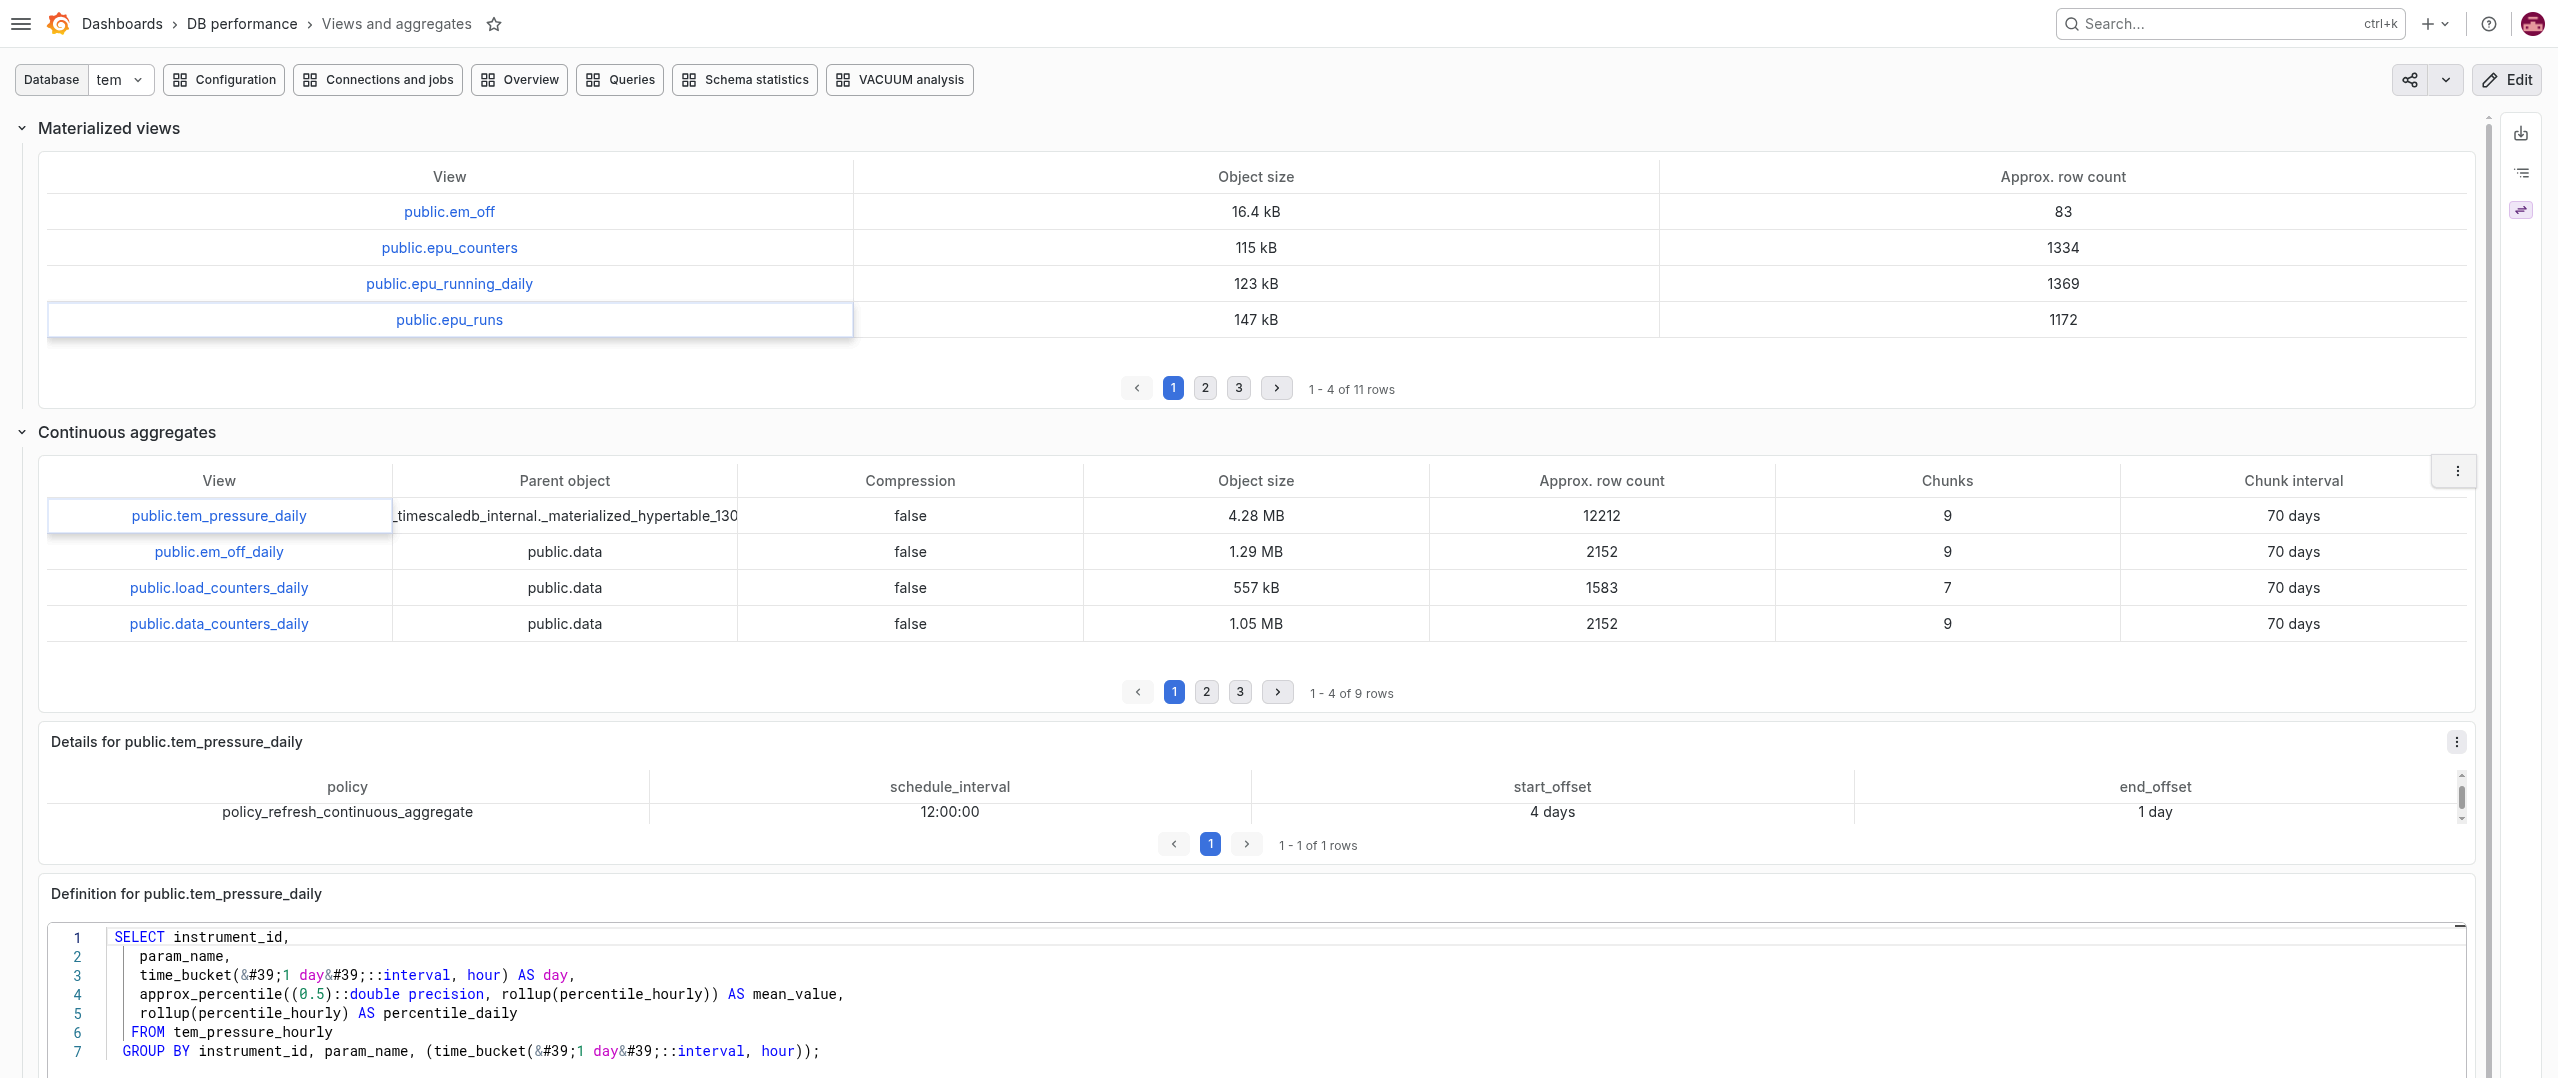
Views and aggregates
The list of materialized views and continuous aggregates. For each view you can see its schedule and the function definition