TEM dashboards
Overviews
Fleet overview
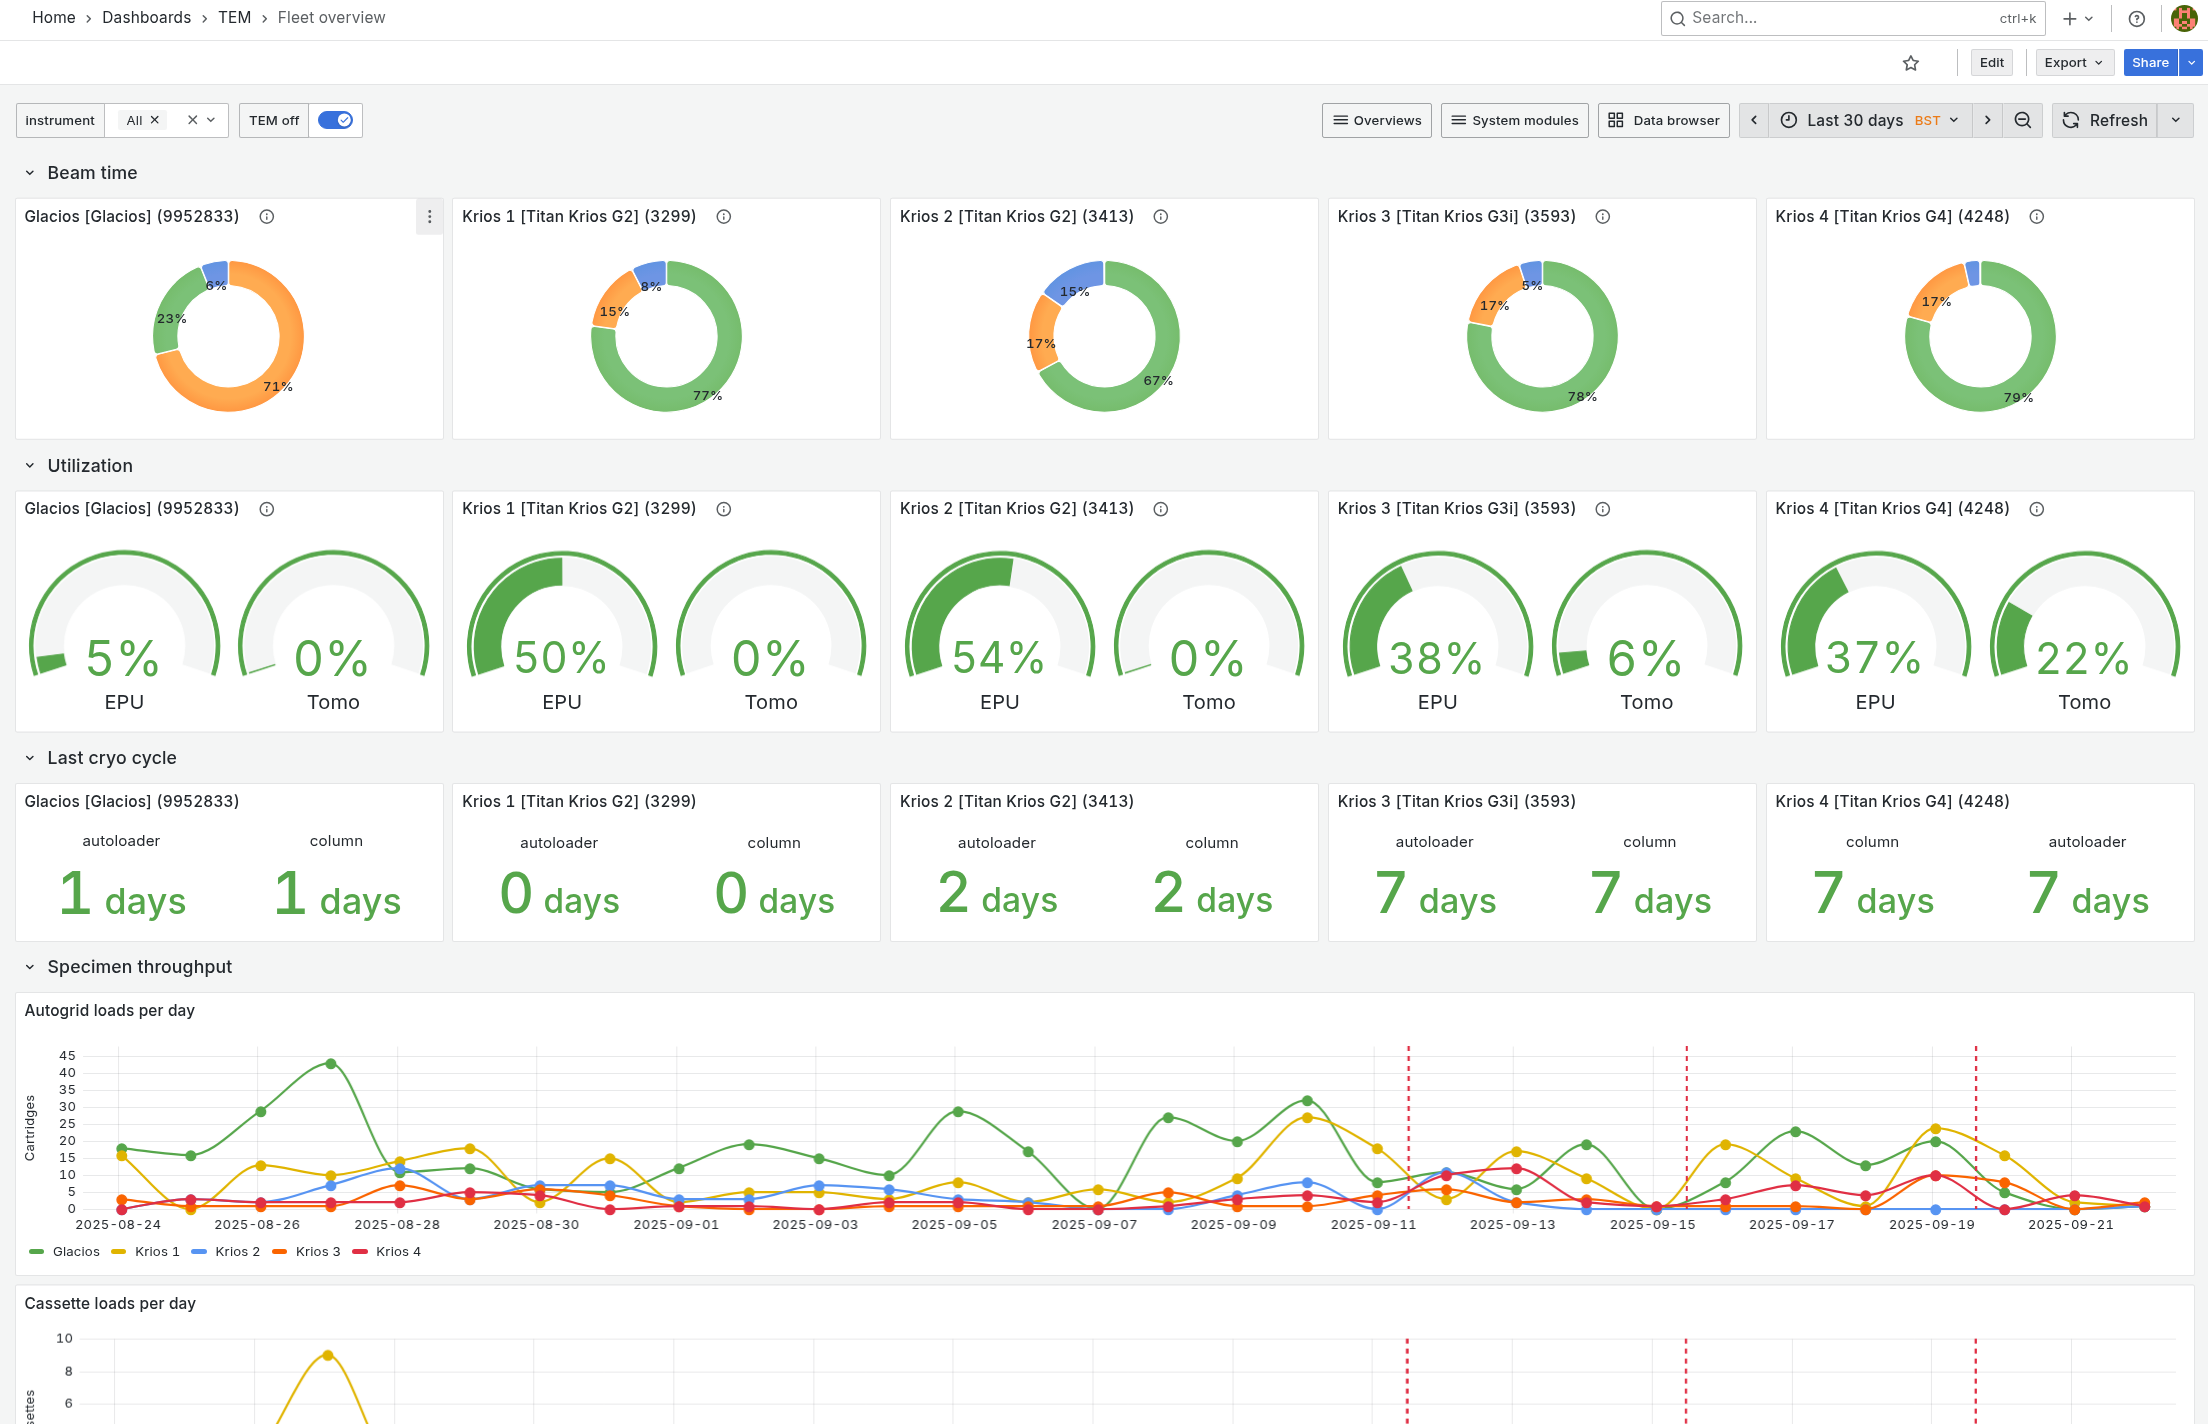
The main overview which compares several key metrics across all active instruments for the last 30 days
Beam Time: pie chart based on the vacuum state of instrument (column valves open, closed, cryo cycle or TEM off)
Utilization: daily average time the instrument spent actively acquiring data with EPU or Tomo
Last Cryo Cycle for autoloader and column
Specimen Throughput: the number of cartridges and cassettes loaded daily
Data Throughput: the number of offloaded movies (both TFS and Gatan cameras) and total data volume (TFS cameras only)
Productivity
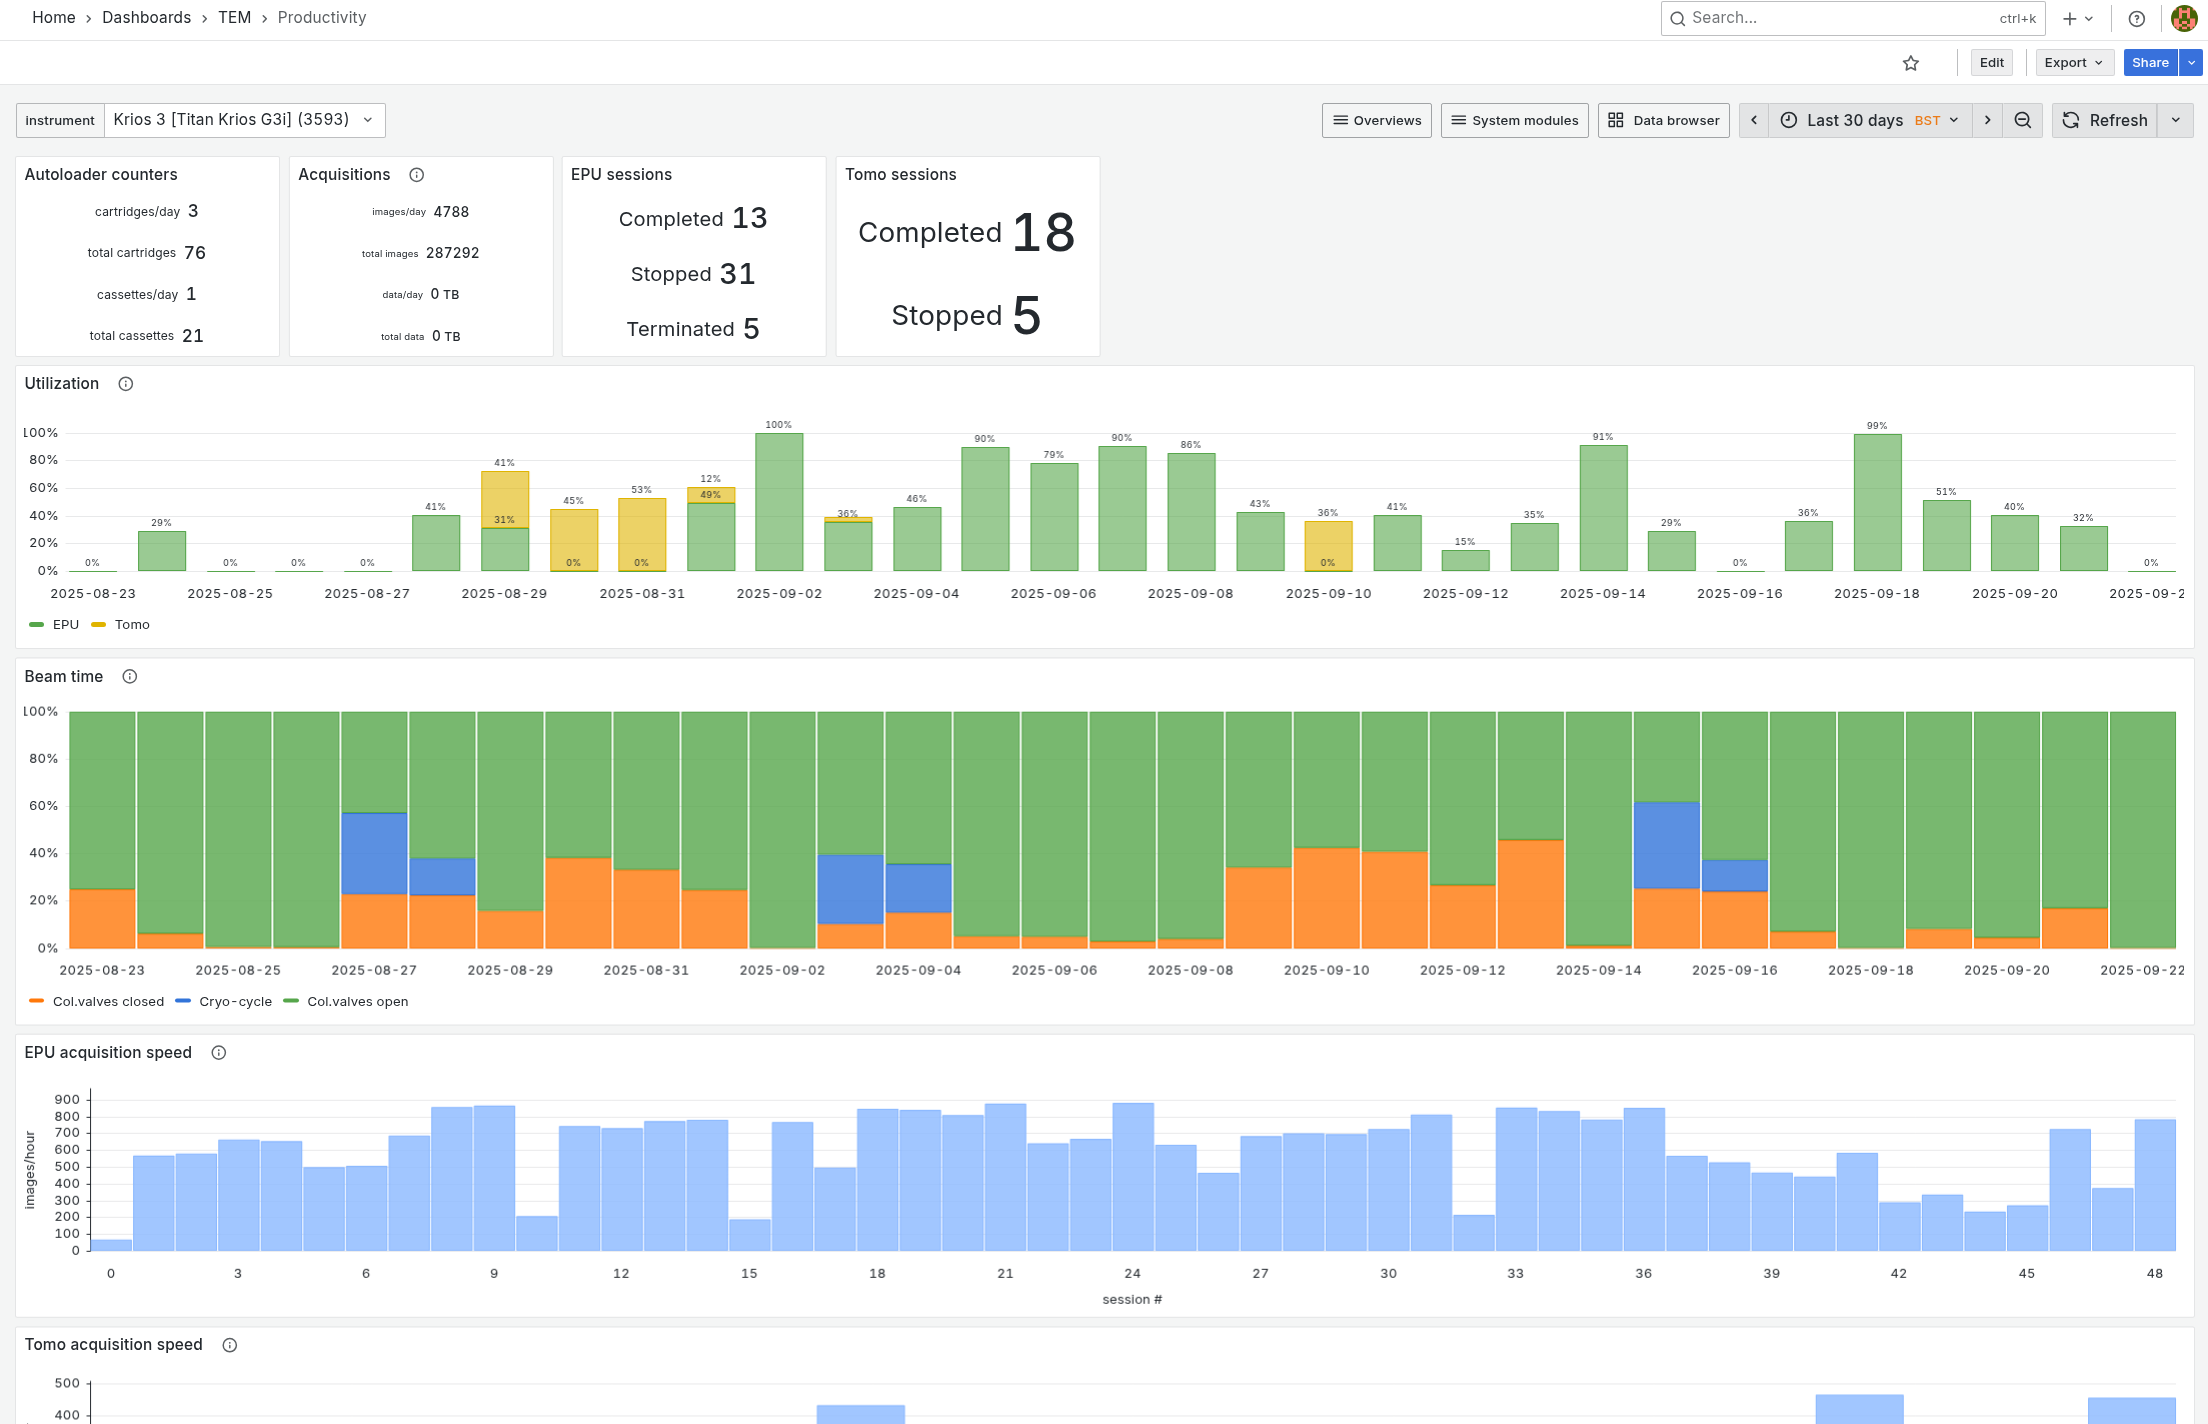
This view shows per-instrument counters for autoloader cartridges/cassettes, acquired images, and EPU/EPU-D/Tomo sessions. The utilization and beam time bar charts provide alternative representations of running acquisition time from the main dashboard.
For each EPU session, we track:
Session ID
Start and End Time
Actual Acquisition Time
Total Number of Images Acquired
Skipped Images Counter
Acquisition Speed
Terminated Status (whether the session ended with an error)
For each Tomo session, we track:
Session ID
Start and End Time
Actual Acquisition Time
Total Number of Images, Tilt Series, and Search Maps Acquired
Tilt series per hour
Acquisition Speed
Terminated Status (whether the session ended with an error)
Alerts
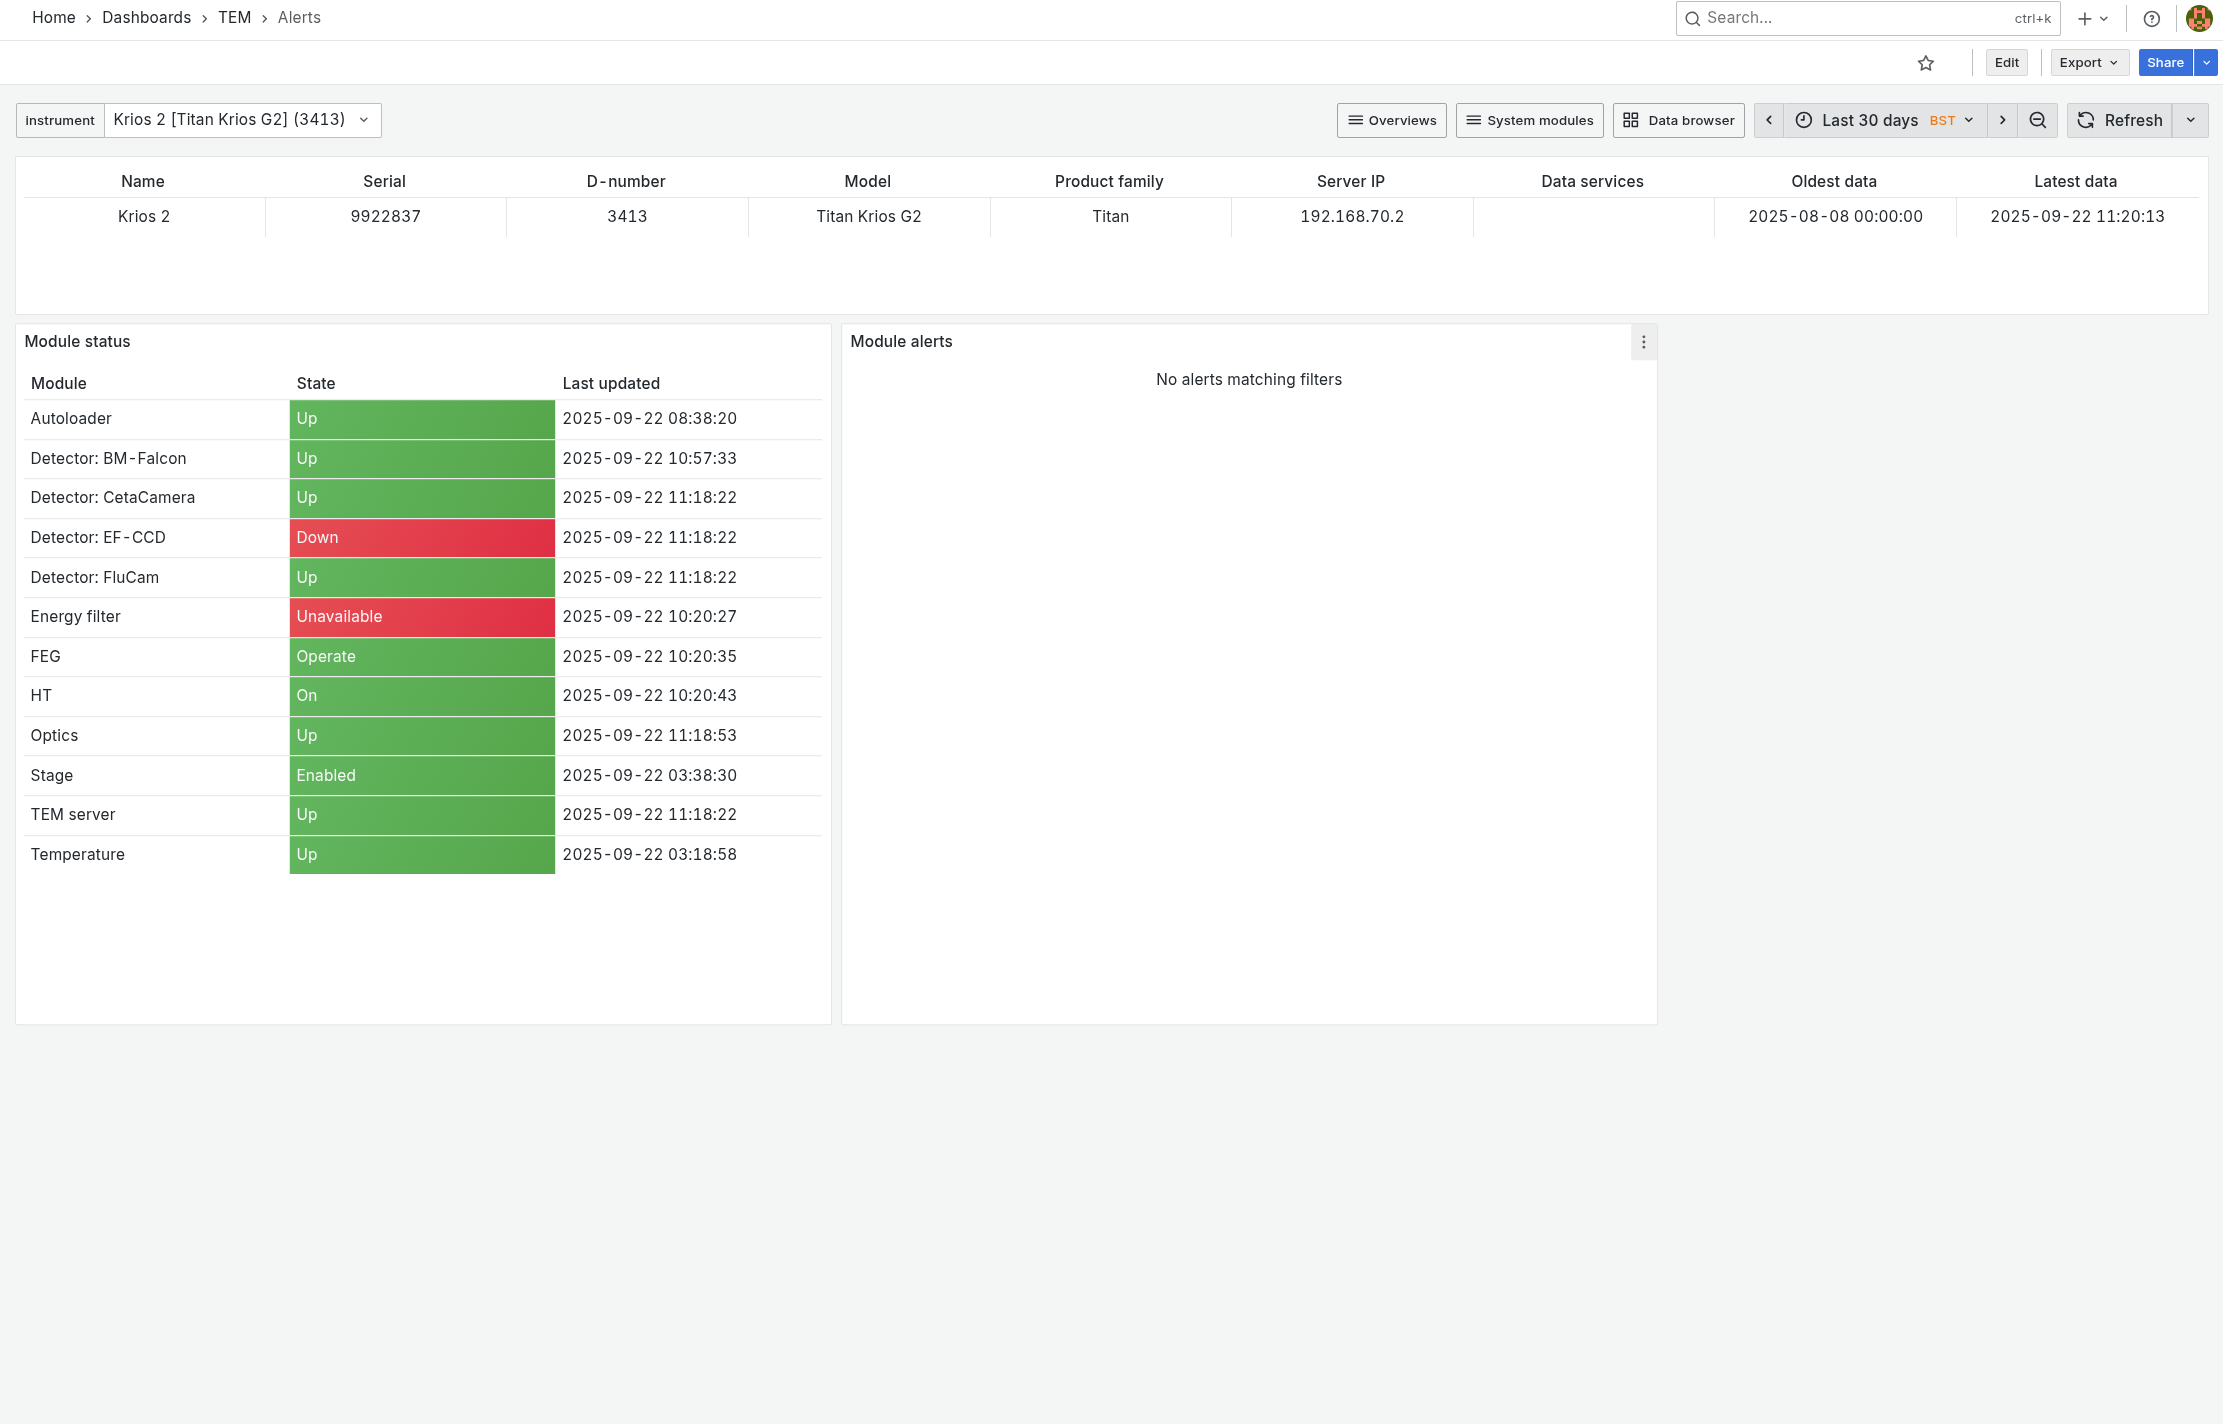
This dashboard provides instrument summary and recent alerts for each microscope module
Modules
Acquisition
A simple view to show the drift measurements done by EPU (during automated acquisition) and atlas realignment values (after cartridge reloading) from Tomo5.
Autoloader
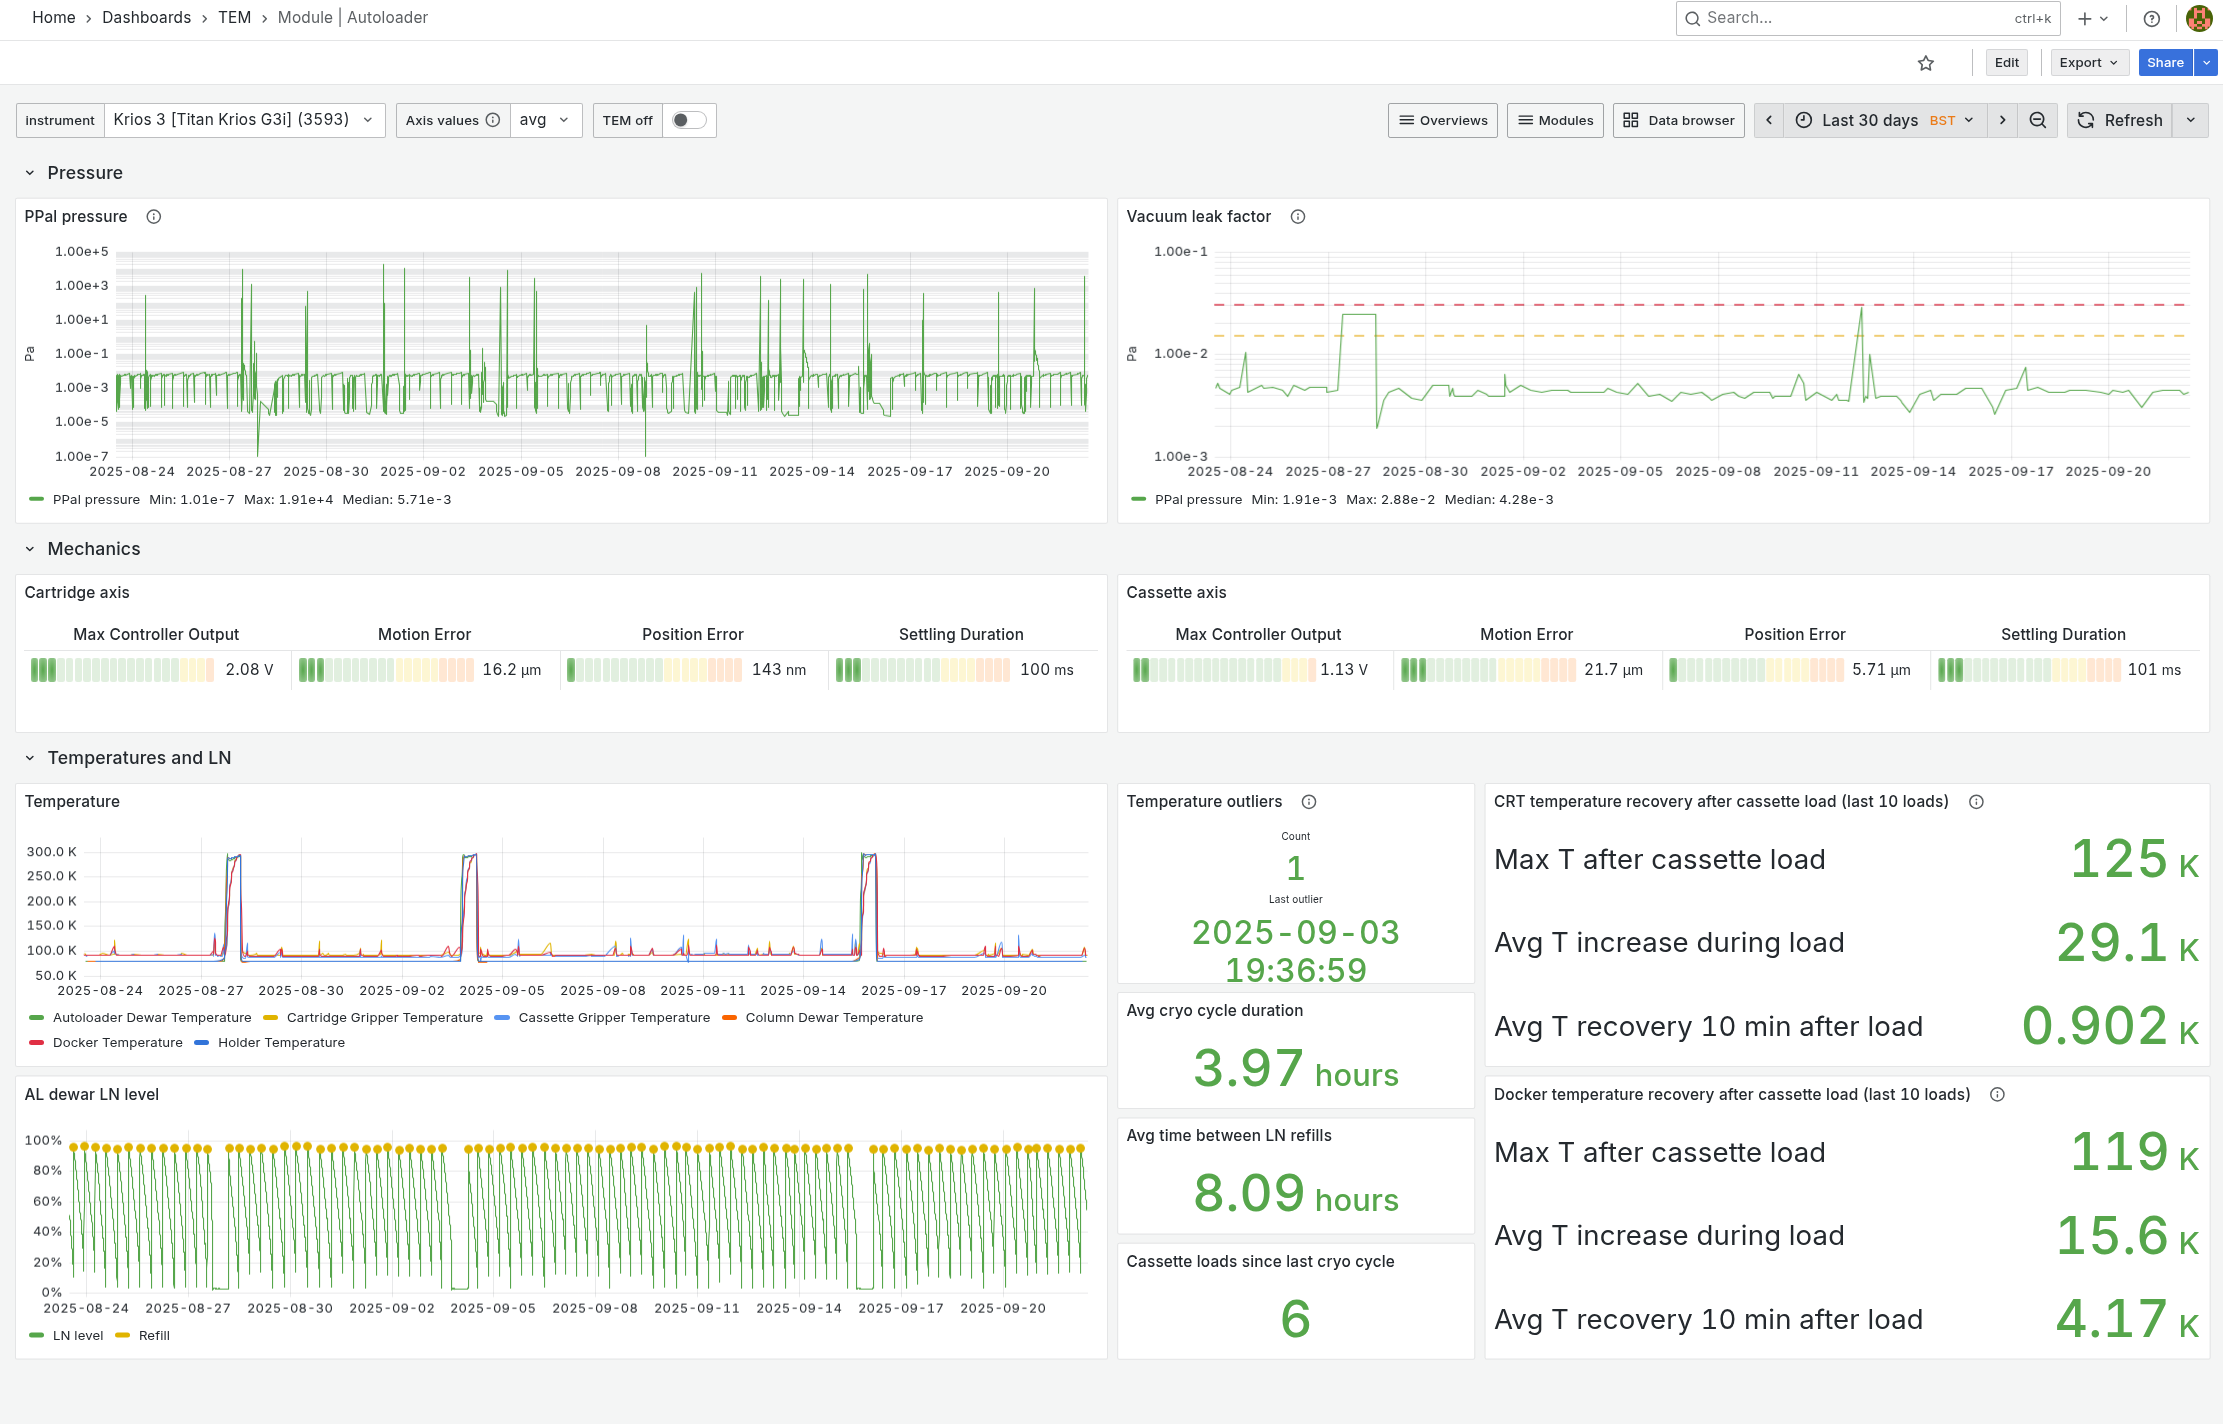
Pressure, axes movements, temperatures, and LN levels are continuously monitored. This view helps you:
Estimate the baseline pressure of the autoloader
Verify the reproducibility of axes movements
Track autoloader components temperatures
Track LN dewar refilling frequency
Display average autoloader cryo cycle duration and number of cassette loads since
Monitor temperature recovery of the CRT and docker after cassette loading
Column
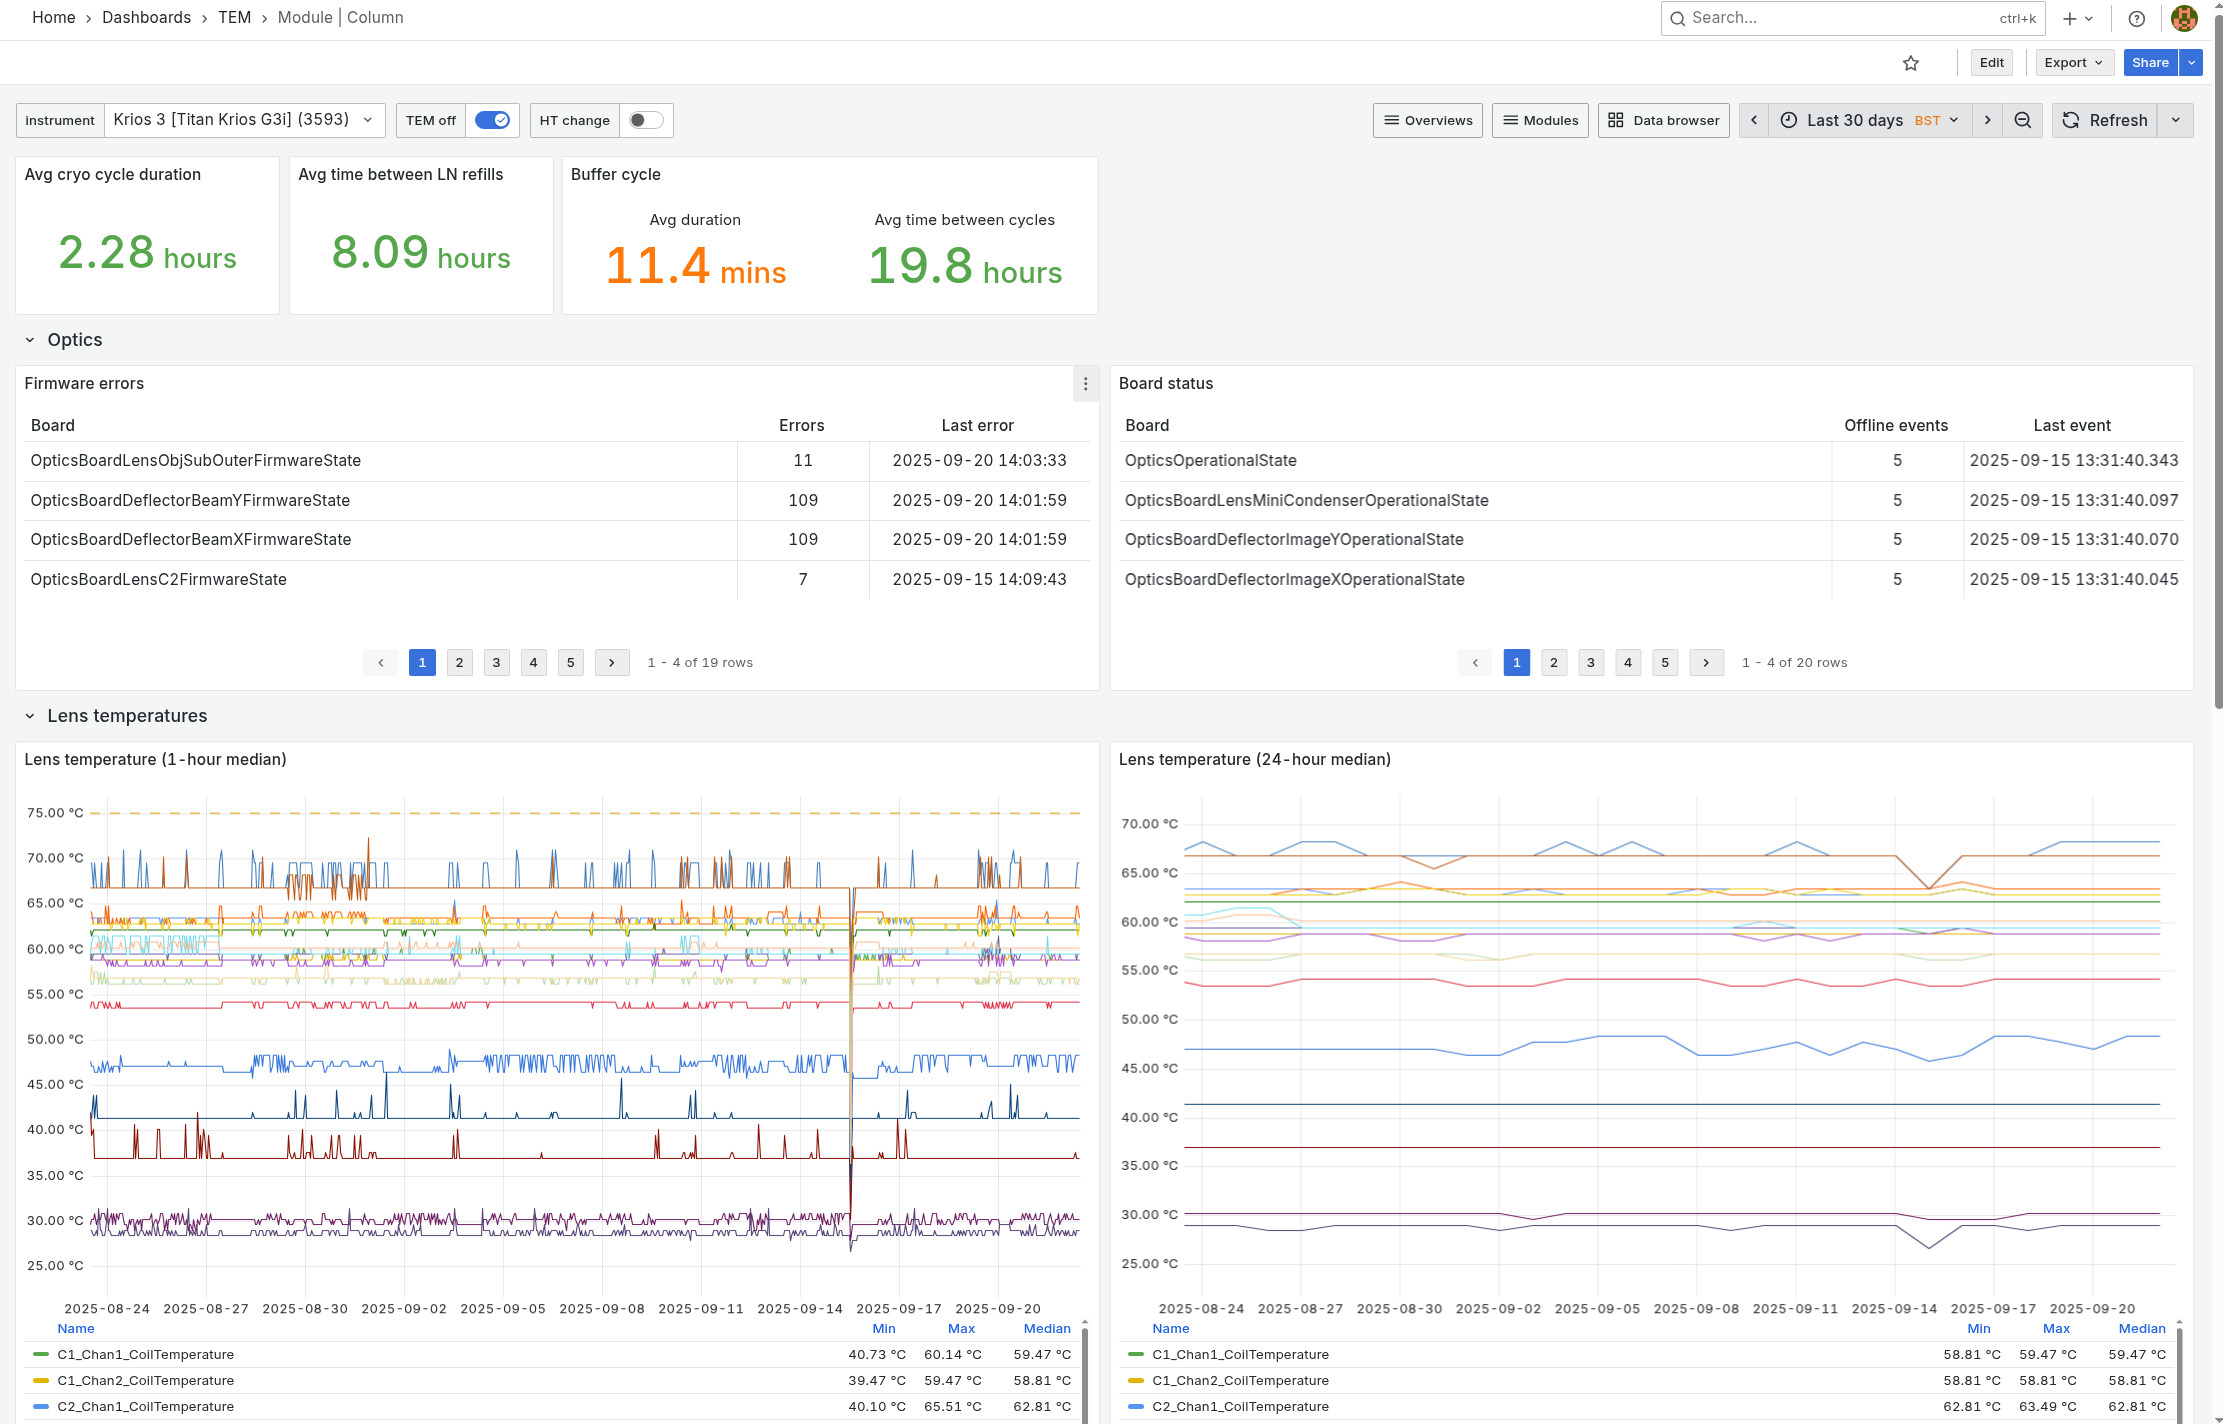
This view displays:
Buffer cycle statistics
Column cryo cycle frequency and duration
Optics board errors
Lens temperatures
Column IGPs vacuum levels, states and lifetime
TMP errors
Detectors
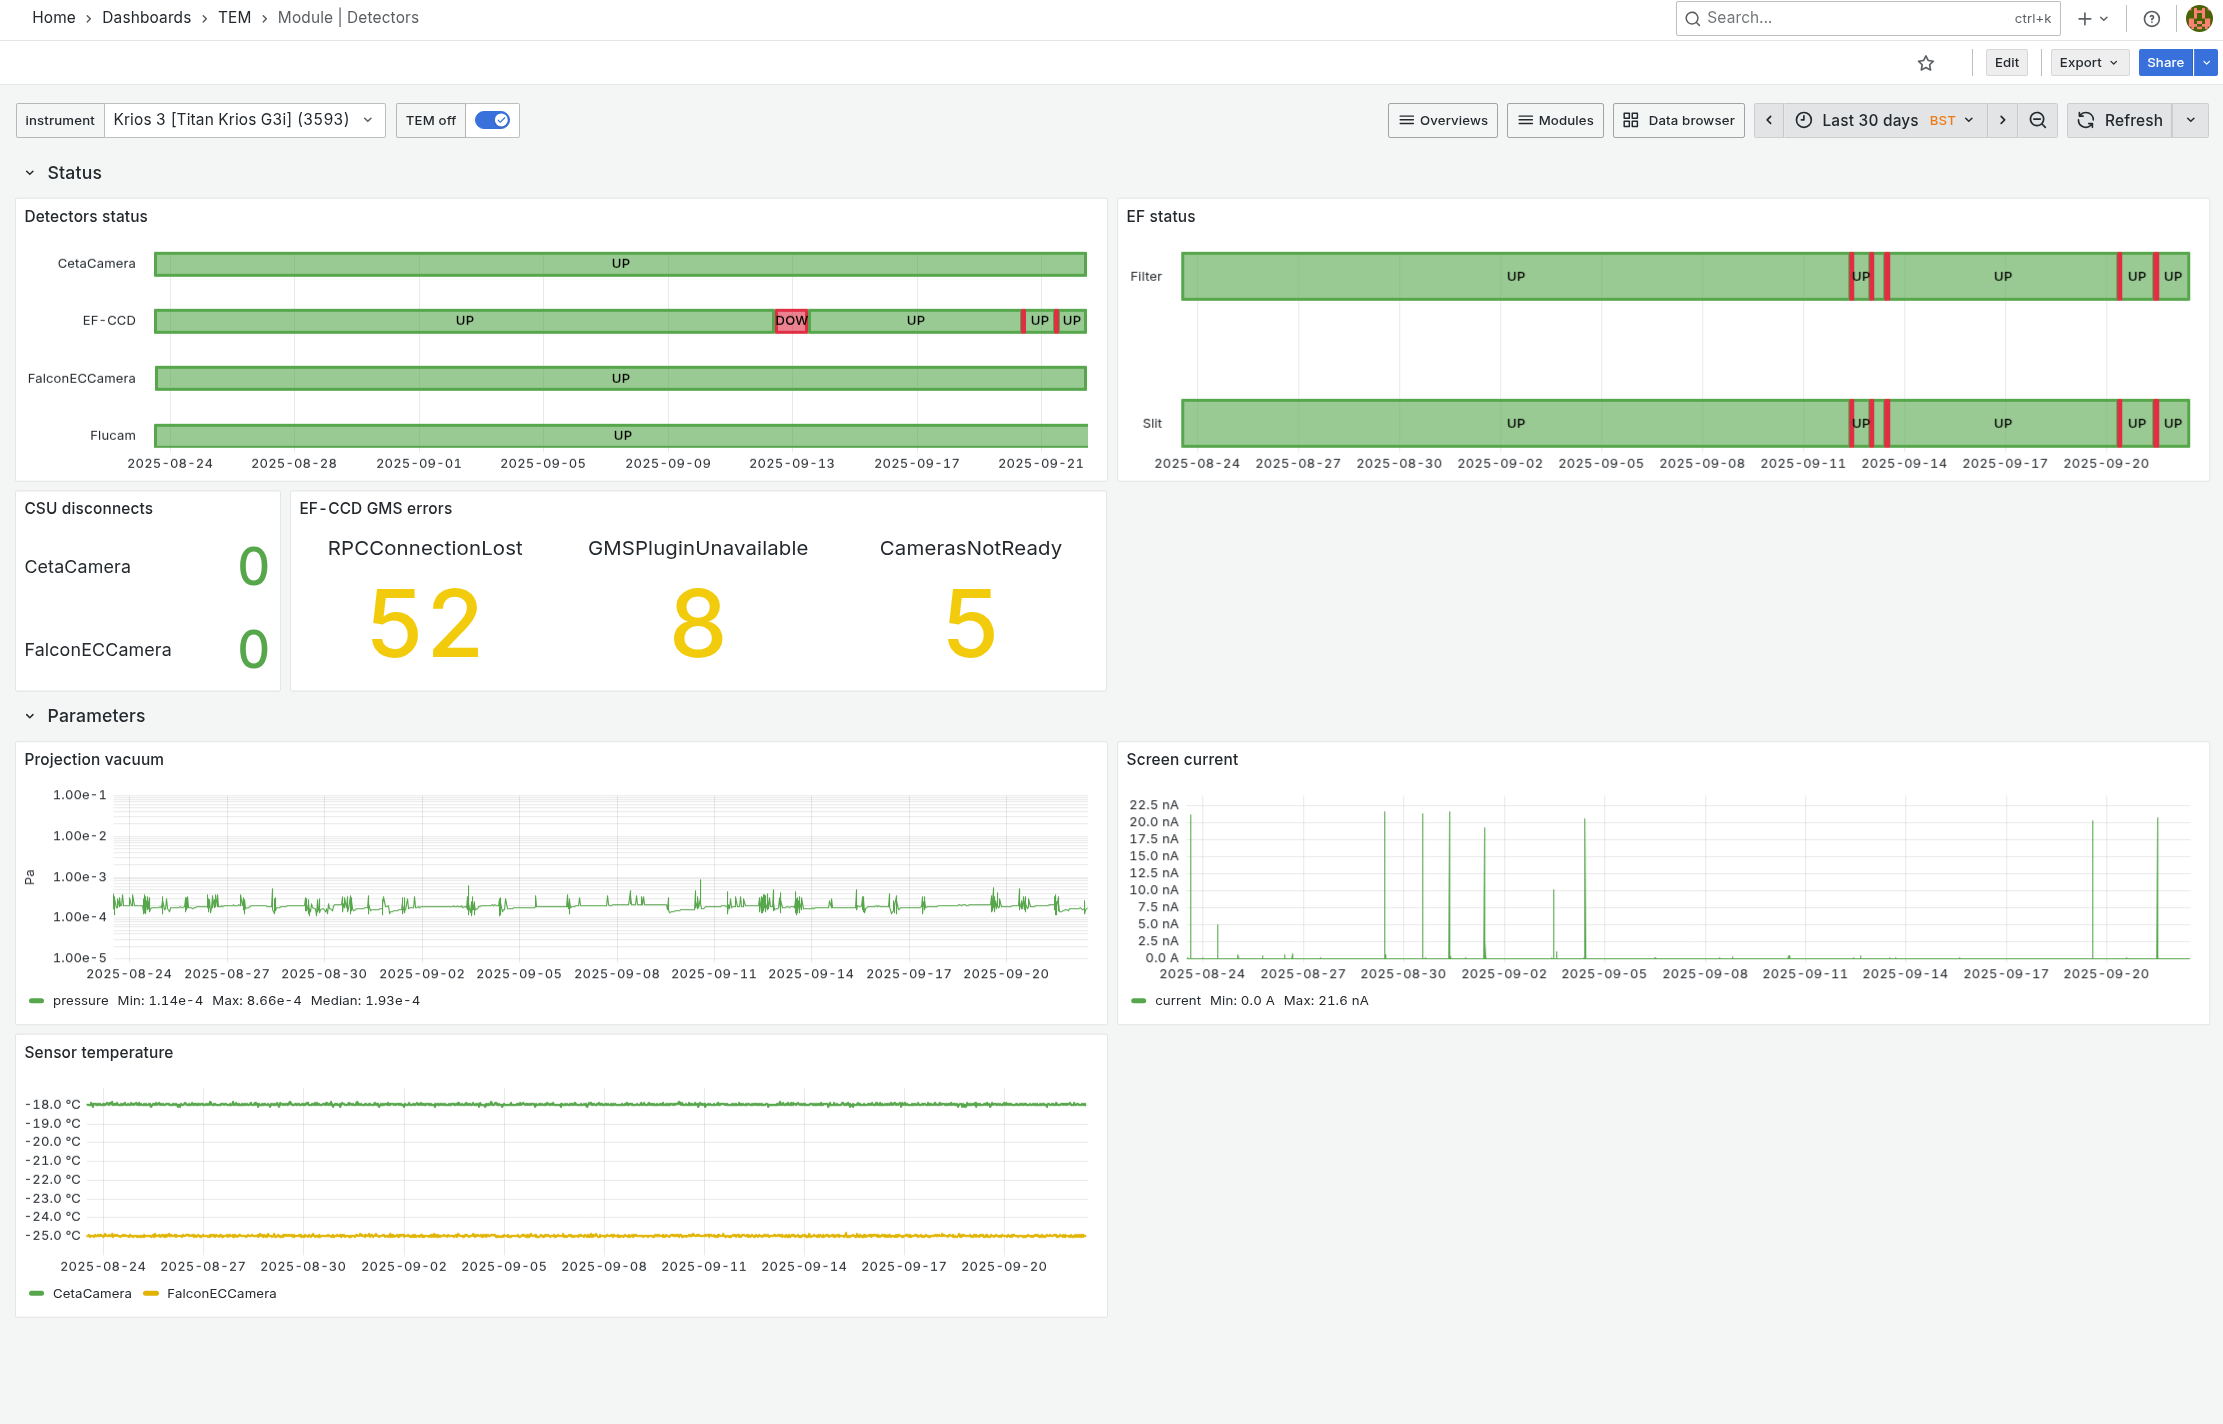
This dashboard monitors:
Overall status for each camera
CSU disconnects and GMS errors
Energy filter and slit status
Projection vacuum (PIRco on Tundra, PPm on Talos and CCGp on Krios systems)
Screen current
Sensor temperature for each camera
Motion
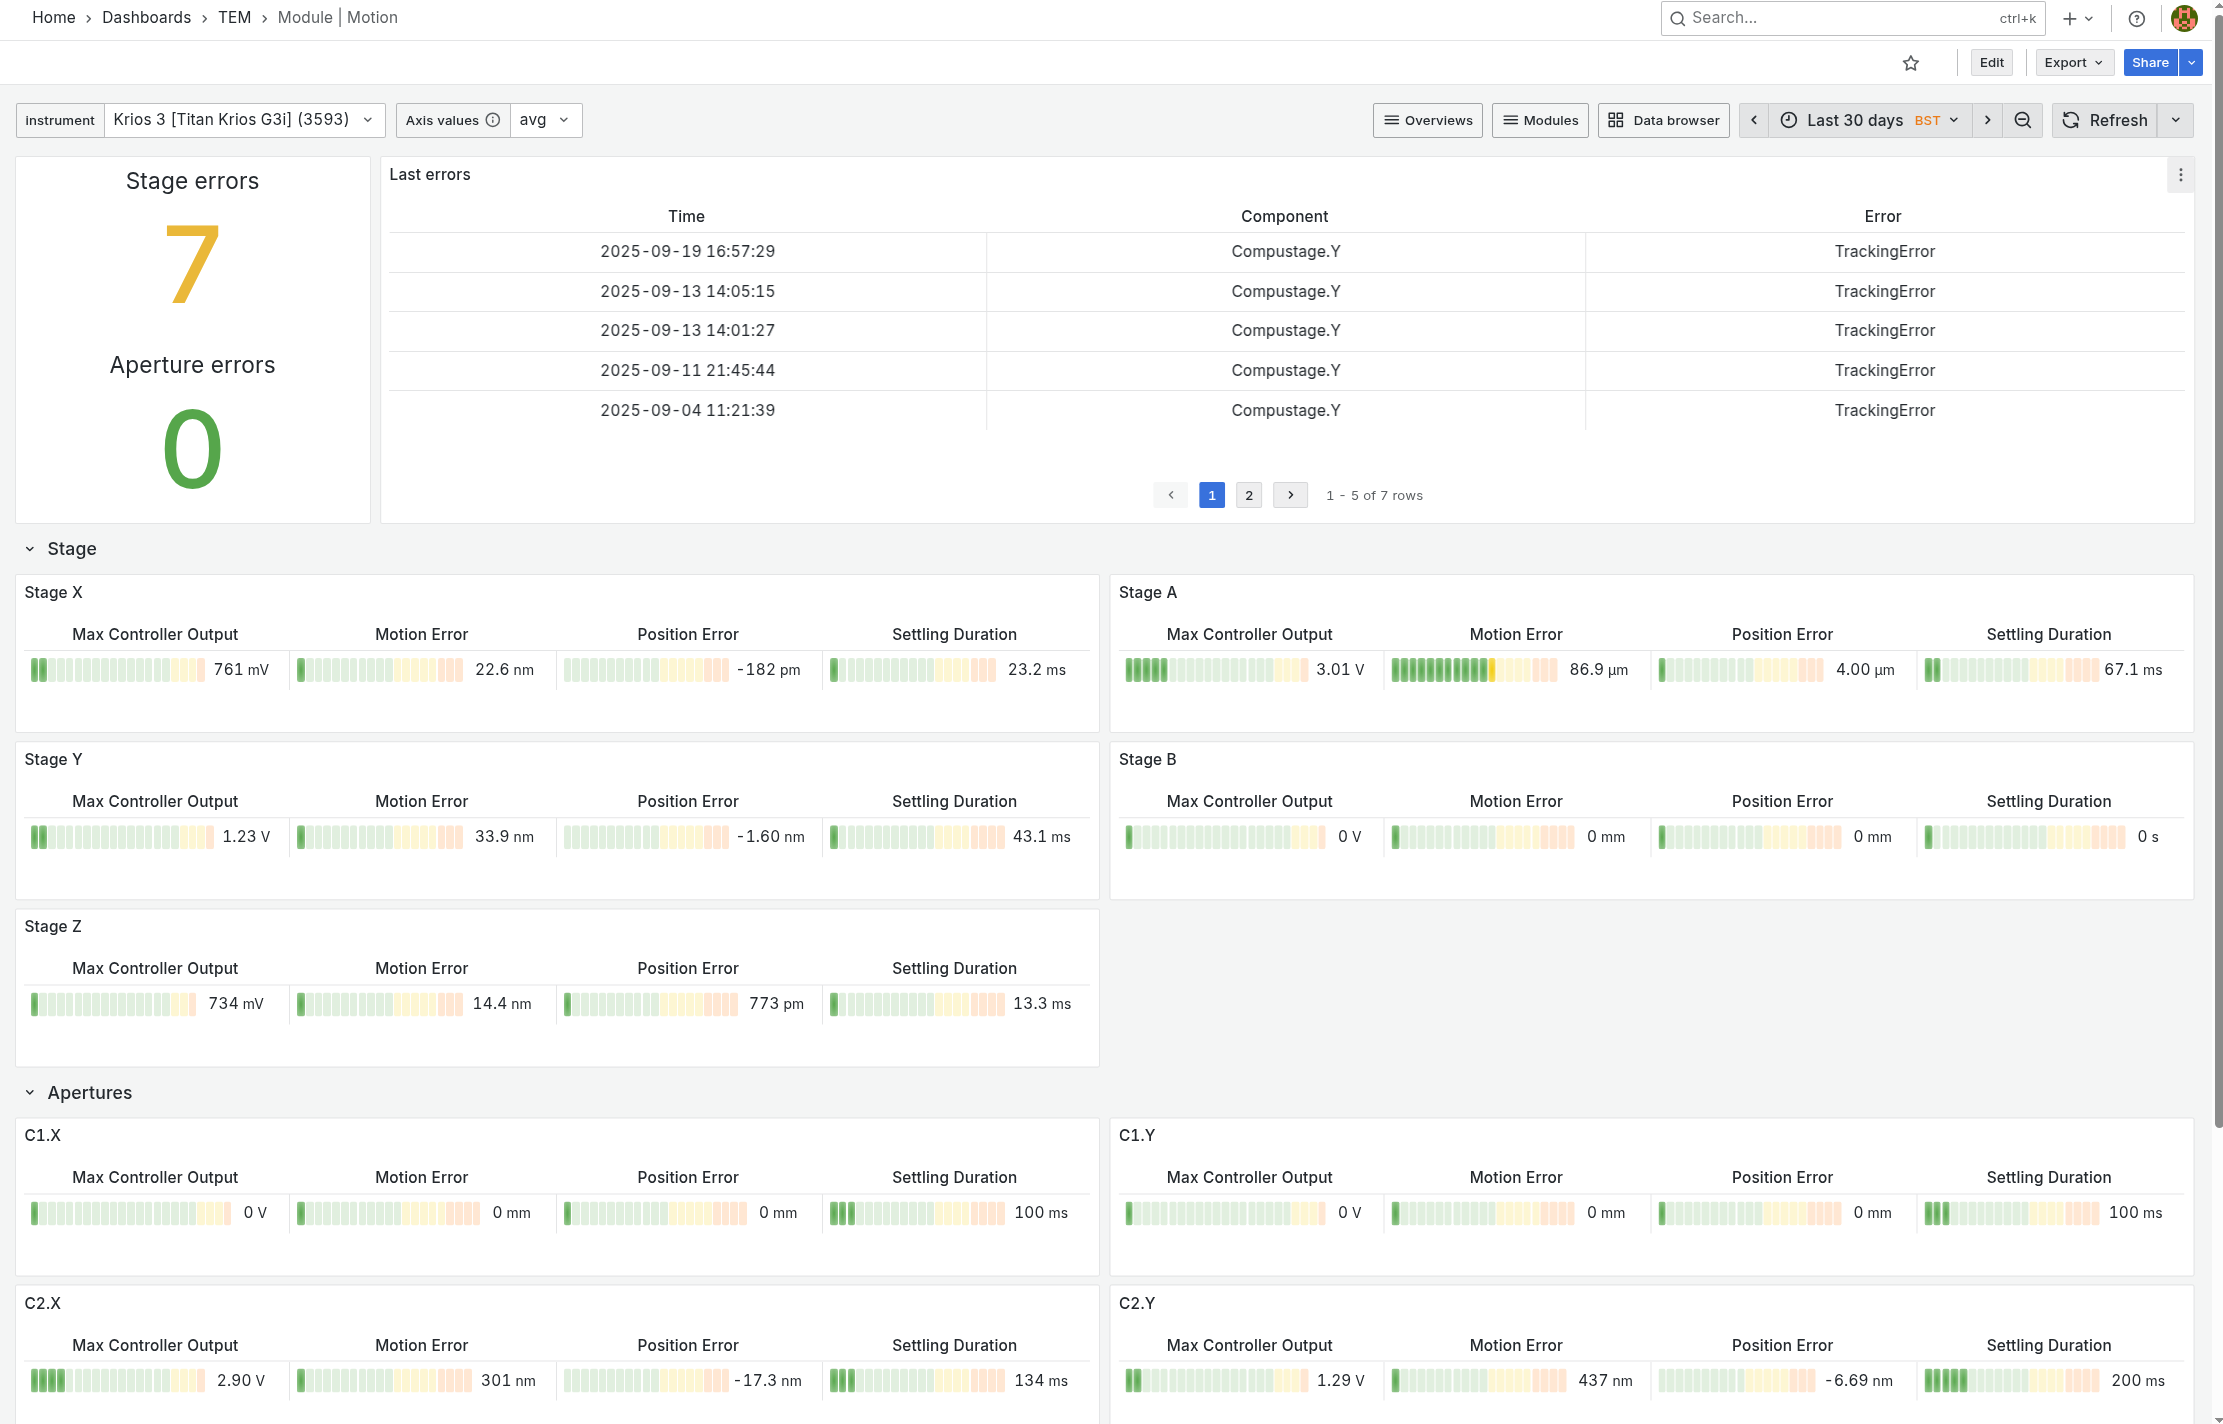
Tracks motion errors and reproducibility of axes movements for all stage axes and apertures
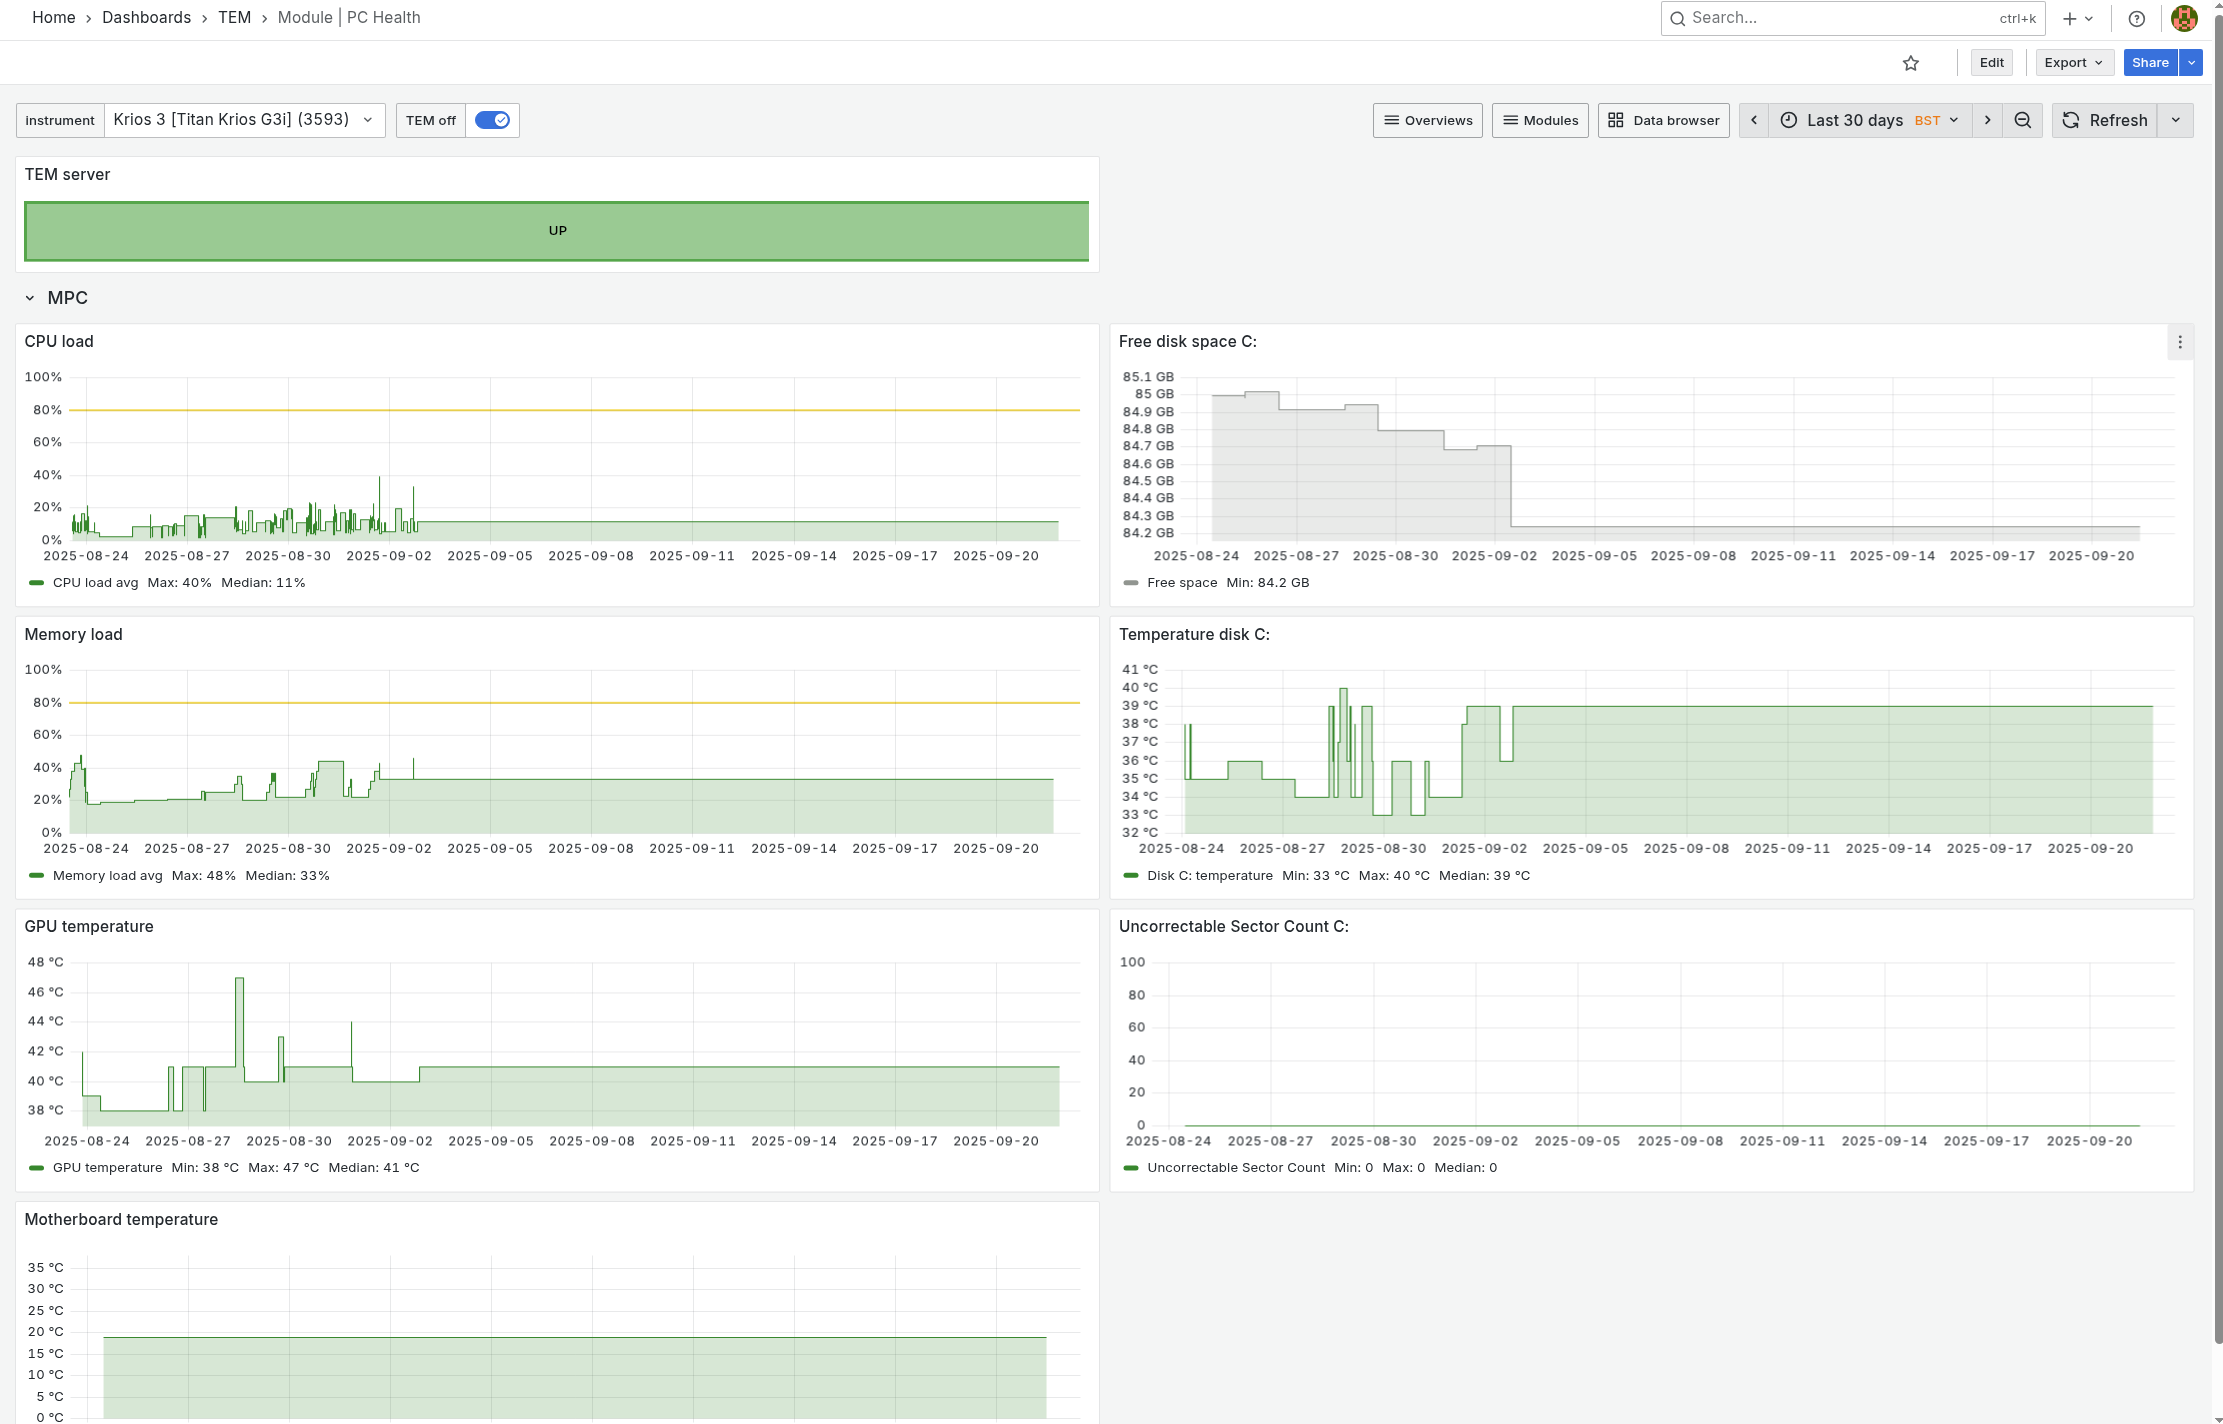
PC Health
Show TEM server status and typical PC stats: CPU, memory load etc.
SemiAutoloader
This dashboard is used for Tundra system only. It display parameters similar to the Autoloader dashboard above:
CLS / Gate pressure
Loading/unloading process stages
Transfer device (TD) positions deviations and motor errors
Temperature mode and values for CLS and microscope column
Column LN dewar level
CLS/column cryo cycle duration ans sample loads since the last cryo cycle
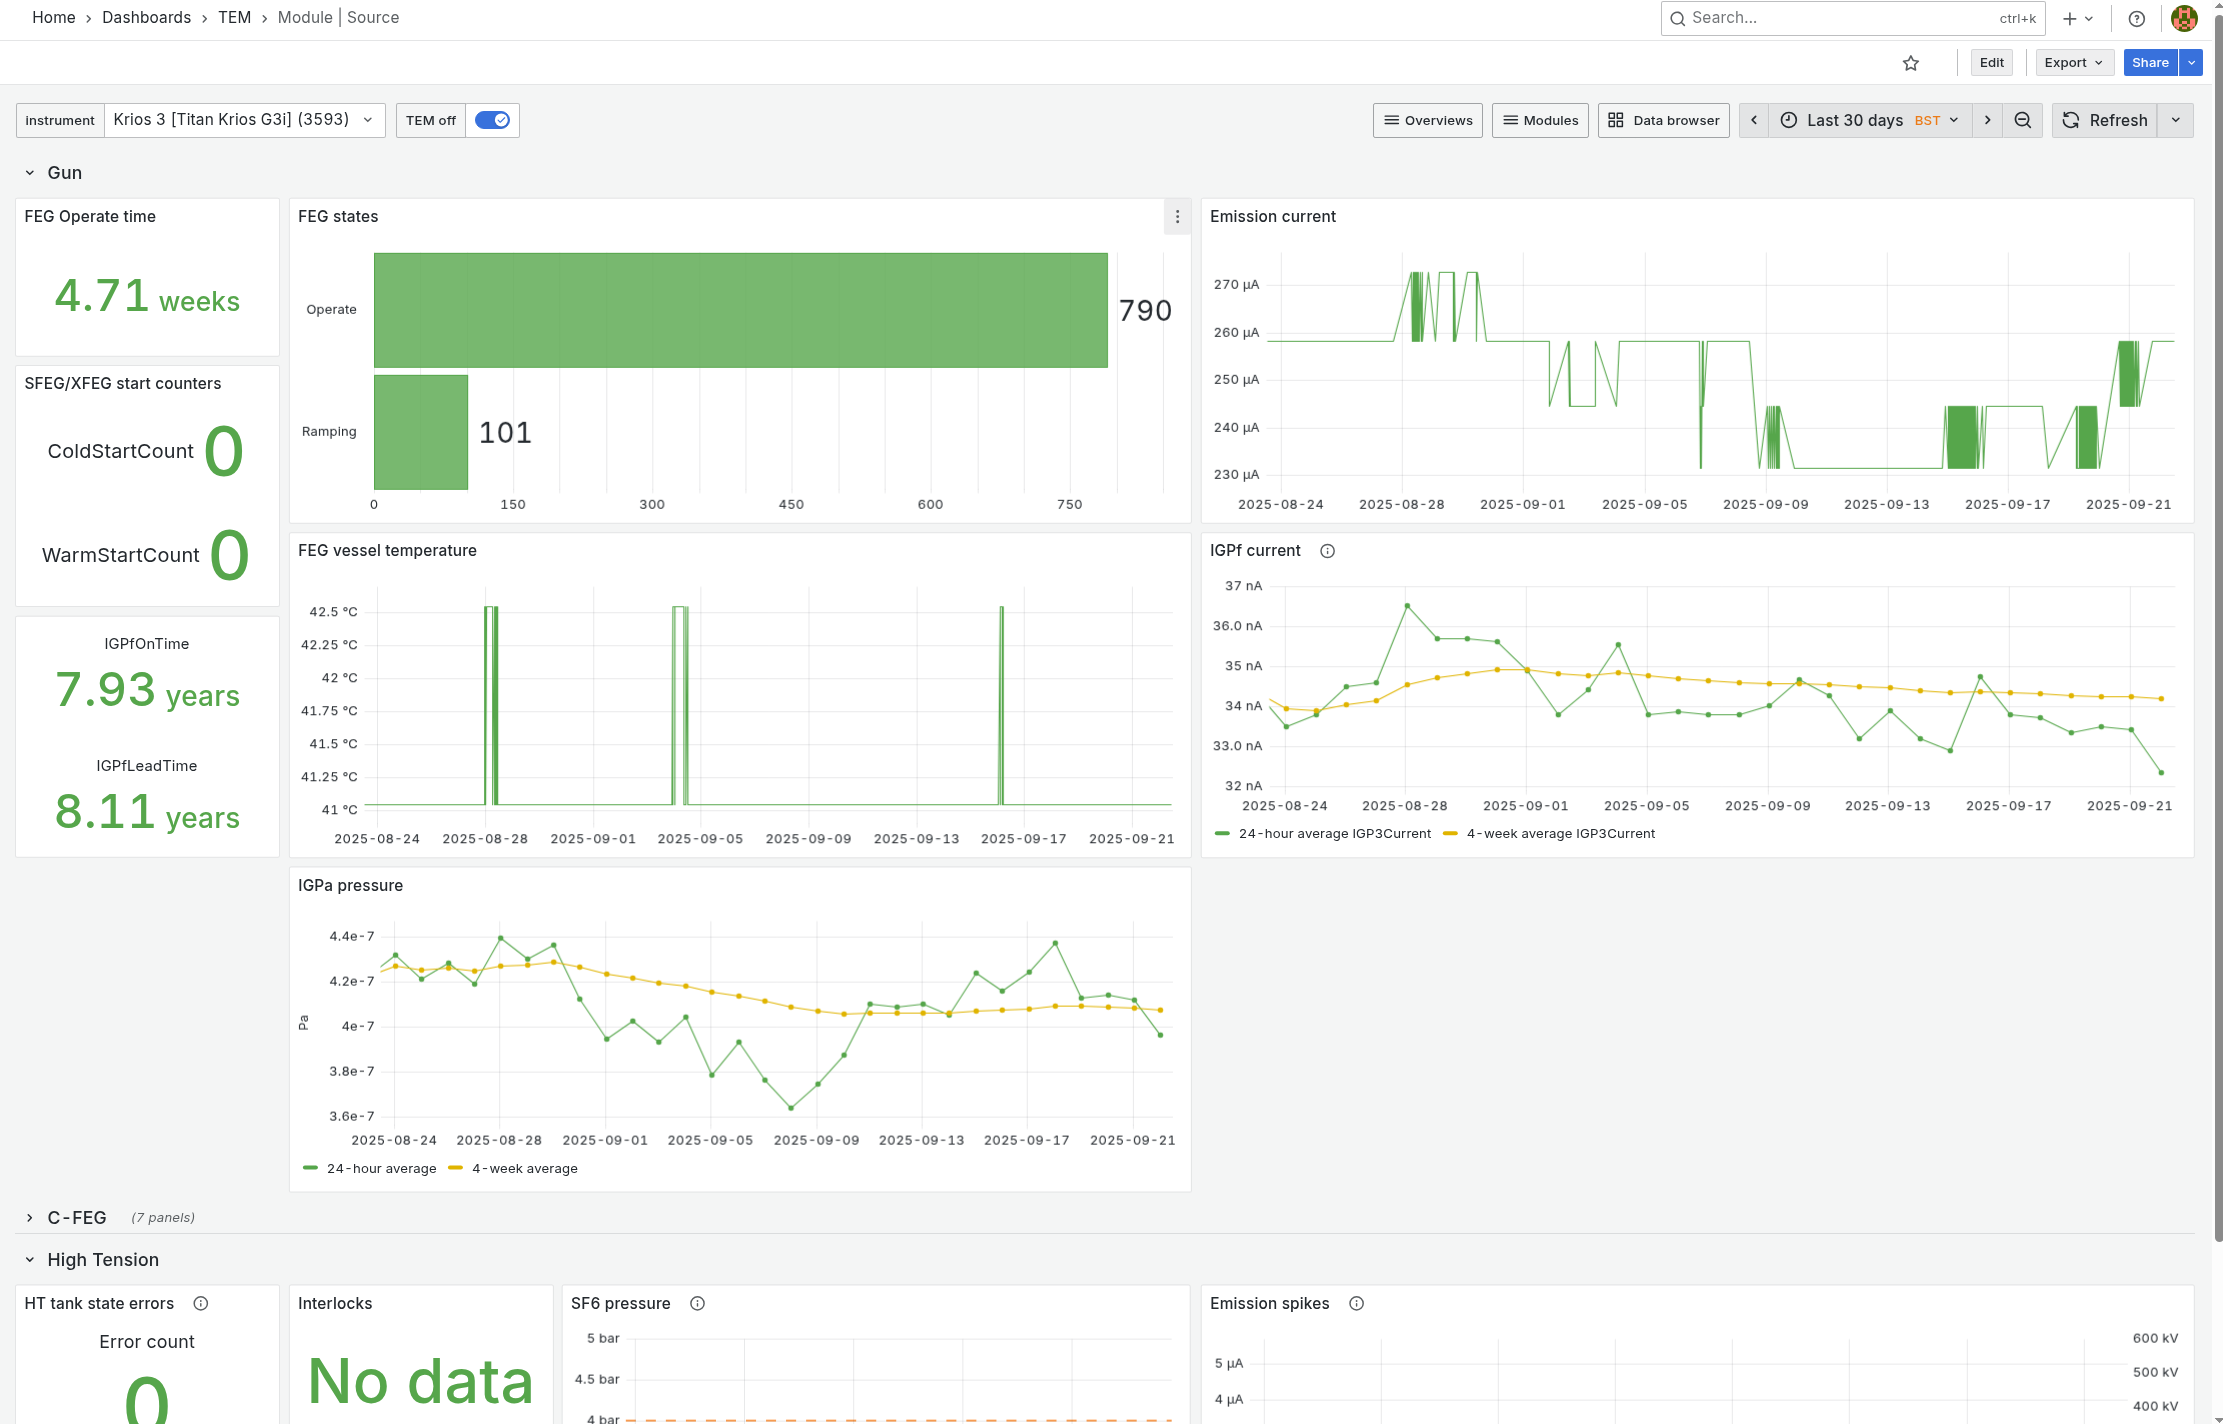
Source
Various parameters for FEG and HT are being monitored:
FEG operate time, warm/cold start counts and states
IGPf operate time and current
FEG emission current and vessel temperature
IGPa pressure
HT tank errors and interlocks
HT emission (dark current)
HT emission vs voltage
SF6 pressure
For C-FEG we do track extra parameters:
high/low temperature flash counts and duration
average time between flashes
extractor voltage vs optimal voltage
beam current
Data browser
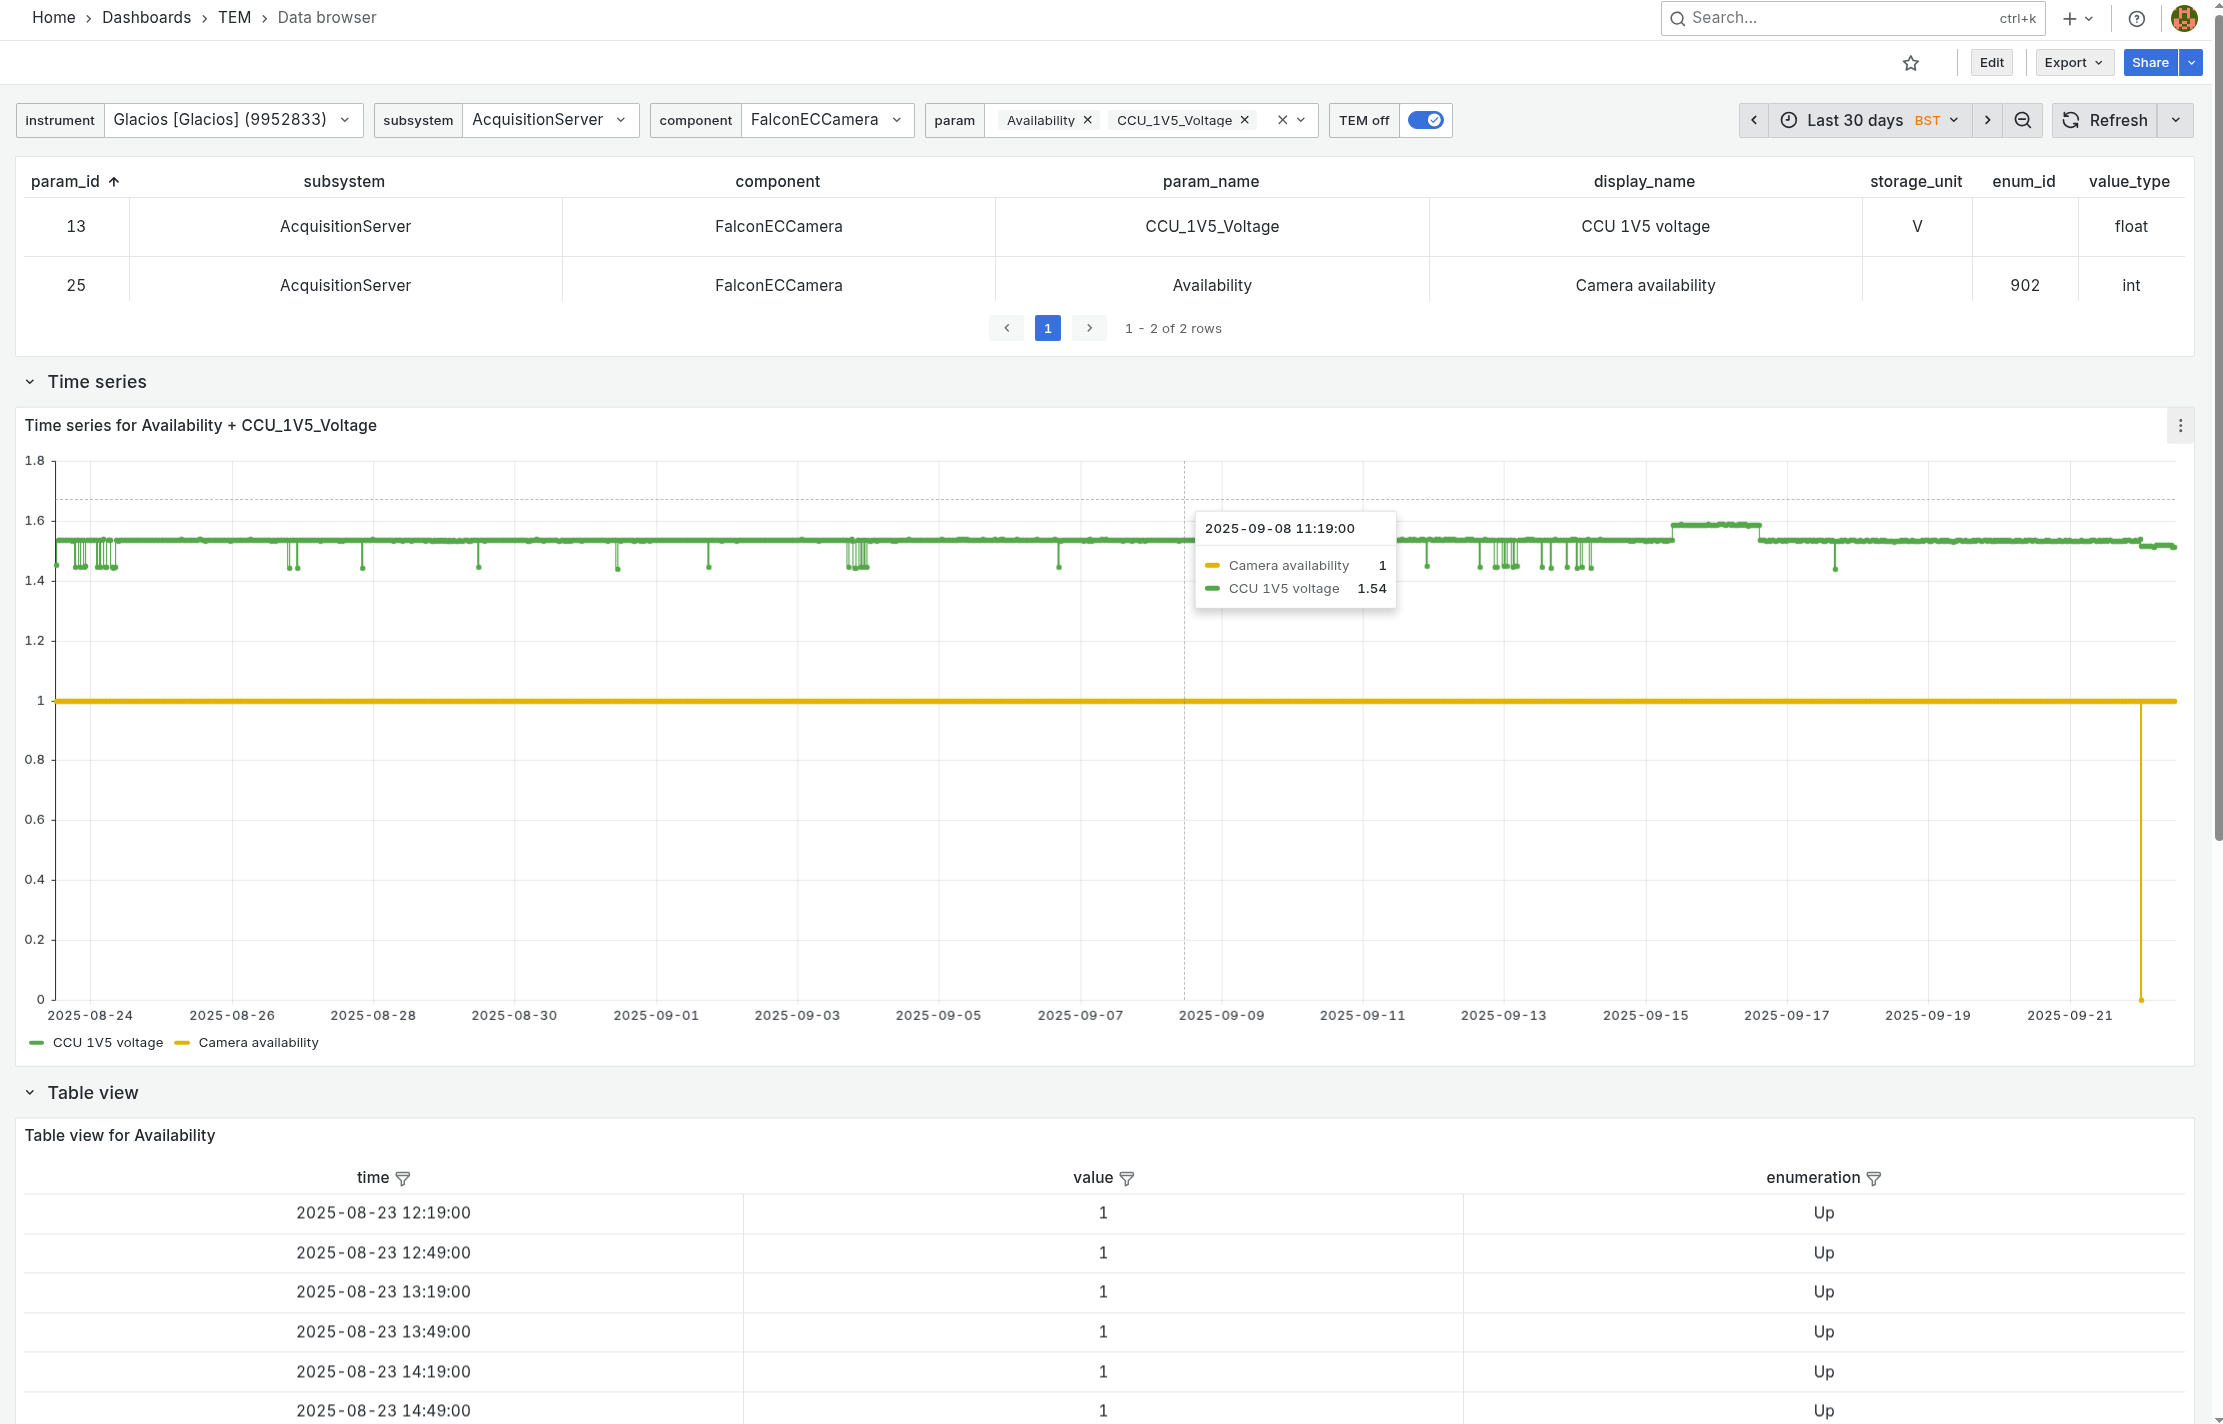
Mostly used for visualizing raw data from the database